Get your FREE 30-day trial.
Please complete all fields.
It might feel like just the other day that your team was planning its holiday marketing strategies and looking ahead to Black Friday and Cyber Monday. And boom — now the holidays are here.
This year's holiday season is poised to be a boon for retailers, with NRF predicting that holiday sales will increase 3.6-4% in 2017. To get you up to date with the state of Black Friday and holiday shopping, consider these 12 holiday stats.
Wondering what to do with all that data? Get planning tips and strategy advice in our new Marketing Holiday Calendar, updated for the 2017 holidays. Download the full calendar for best practices to guide the rest of your marketing this year and into 2018.
1. In 2017, digital grew 34% globally during the shopping season. Across the leading digital commerce markets, Canadian shoppers pushed gains highest, though more mature markets like the U.S. and U.K. enjoyed double-digit growth, with the U.S. market seeing 36% growth (via Commerce Cloud).
2. Free shipping remains at an elevated level throughout the entire season, peaking on Cyber Monday at 87% (via Commerce Cloud). Cyber Week discounts are generally double what they are during a non-peak period. Plan your promotions as a means to help you stand out and win shoppers.
3. The first seven days of the shopping season (Tuesday, November 22 through Cyber Monday, November 28) accounted for 35% of the entire season’s revenue — and 6% of the entire year in 2016 (via Commerce Cloud).
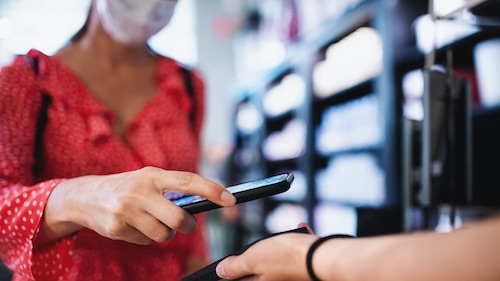
4. In the 2016 holiday season, for the first time ever, peak season traffic was mostly mobile, with 52% of all shopping visits happening on phones (via Commerce Cloud). Your consumers are already mobile-first, so every touchpoint along your shopper journey should follow.
5. Facebook is far and away the primary driver of social traffic, baskets, and orders, carrying over 80% of each KPI. Instagram and Twitter follow, except in the U.S., where Pinterest places second behind Facebook (via Commerce Cloud).
6. Shoppers flock to the site search bar during the holiday shopping season, as brands see 8% of traffic using site search and retailers see 13%, up from 6% and 10% respectively during off-peak times (via Commerce Cloud).
7. Gen Z spending will be up this year: 54% of consumers overall plan to spend about the same during the 2017 holiday as they did last year, with 24% planning to spend more. But among those ages 18-24 — which includes the oldest members of Generation Z — 46% say they will spend more than last year (via NRF).
8. Gift card spending will be up this year. Holiday shoppers plan to buy four gift cards on average this year, with an average value of $45 per card. That makes gift cards the second most-popular gift after clothing. Spending on gift cards will reach $27.6 billion this year, up from $27.5 billion in 2016 (via NRF).
9. In NRF's 2017 survey of those considering shopping over the long holiday weekend, 20% of shoppers plan to shop on Thanksgiving Day (32 million) but Black Friday will remain the busiest day with 70% planning to shop then (115 million).
10. In today's shopping journey, buyers don’t simply stop and shop. Rather, they graze: visit, bounce, and return. In 2016, buyers visited an average of 3.4 times during the season (via Commerce Cloud).
11. In 2016, Black Friday saw 53% share of traffic on phones, while Cyber Monday saw 49%. Later in the season, shoppers turned to their phones even more, with Christmas Eve, Christmas Day, and Boxing Day pushing mobile traffic share to record levels (via Commerce Cloud). Expect to see new mobile heights reached this year.
12. When asked what they enjoy the most about shopping during the holidays in an NRF survey, 35% said it's the family tradition aspect, while 23% said they're all about the decorations and displays. Meanwhile, 18% cited finding the perfect gift for someone.
Did these stats inspire you to double down on your holiday marketing? We've got just the ticket in the 2017 Marketing Holiday Calendar. Get your free calendar (perfect for wall-hanging) today.