Get your FREE 30-day trial.
Please complete all fields.
Salesforce has aggregated and analyzed all the advertising spend through our advertising platform (Social.com) from April 2015 to June 2015. In this post, we provide key highlights of the analysis; a deeper dive into the data, including performance metrics by country and industry, are in our full report.
Key findings include:
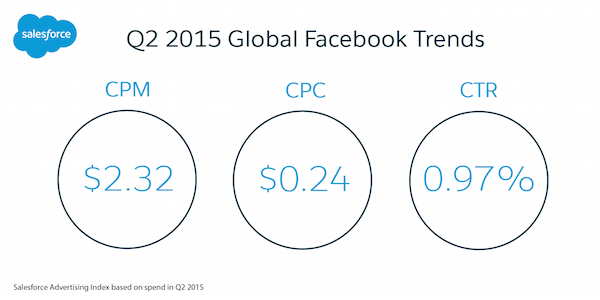
Facebook global CPM rose 22% between Q1 and Q2 to $2.32 and CPC remained flat at $0.24
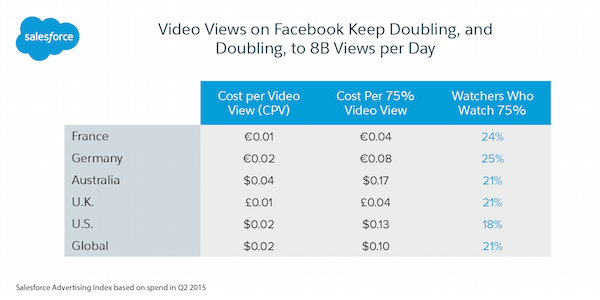
Cost-per-video view (CPV) across five key markets was $0.02 each and 21% of the people who started watching the video watched 75% of it
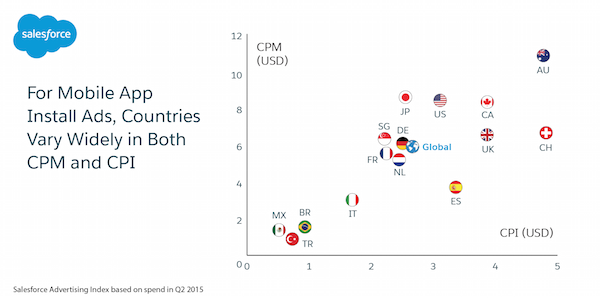
Mobile app installs are 600% more expensive in Switzerland than in Mexico
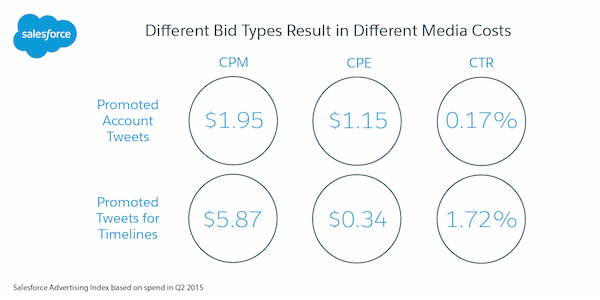
Twitter Promoted Timeline Tweets remain highly engaging with a 1.72% CTR
LinkedIn costs rise globally with the United States rising to $31.30
Globally, Facebook CPM rose between Q1 and Q2 from $1.90 to $2.32. CPC, however, was flat, at $0.24 in both quarters. The CPC in France, the United Kingdom, and the United States all decreased slightly while it ticked up in Australia and Germany.

For video ads optimized for views across five key markets, it cost $0.02 for each three-second video view. It cost $0.10 for people to watch 75% of the video; 21% of the people who started watching the video watched 75% of it. Video view costs ranged from €0.01 in France to AUS $0.04 in Australia.

Mobile app advertisers tend to run multi-region campaigns in which they are strongly focused on which markets deliver effectively priced app installs of customers who produce a true ROAS. Different European countries have very different CPIs, ranging from a high of $4.82 in Switzerland to $1.69 in Italy. Mexico and Brazil are less expensive for app installs than any European country except Turkey.

Similar to last quarter, the Twitter CPM was $5.87 for Promoted Timeline Tweets and a much lower $1.95 for Promoted Account Tweets. However, Twitter ads are entirely purchased on a cost-per-engagement basis, not on a per-impression basis, and the cost per engagement was only $0.34 for Promoted Timeline Tweets, with a very healthy 1.72% CTR.

This quarter, we broke out the LinkedIn CPM for multiple countries for the first time. We saw a substantial cost increase from prior quarters across all geographies, as the LinkedIn inventory becomes more competitive as advertisers see value in the premium users of the LinkedIn solution.