

Get your FREE 30-day trial.
Please complete all fields.
 In the fast-growing world of social advertising, it’s key for you to keep up with the shifting landscape. This week we have three advertising insights: Facebook ads served, video engagement by device and length of video, and trends in the travel advertising industry to help marketers and advertisers stay on top of the space.
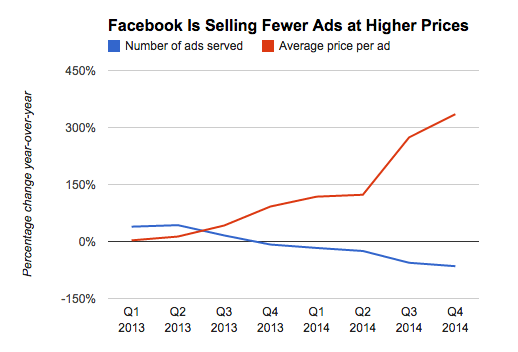
This graph by AdAge depicts Facebook’s decision to emphasize ad quality rather than ad quantity. Facebook has cut back the number of ads displayed (especially with the new, larger right hand side ads), and coupled with increasing demand, the price of the ads is increasing. We encourage you to pay attention to macro Facebook advertising trends to understand how they affect your own advertising budgets.
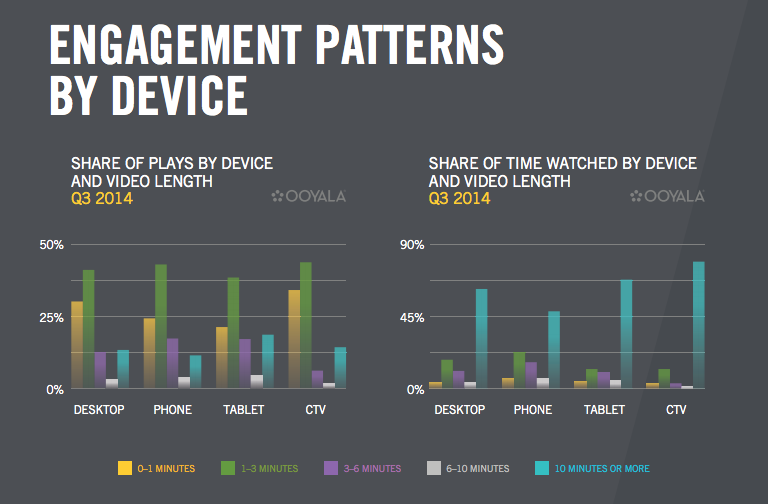
OOYALA published its Global Video Index for Q3 2014 that includes this chart on video engagement patterns across desktop, phone, tablet, and connected TV. This information can help you determine the best channel and length for your video content. The sweet spot for video consumption is between one and three minutes, and your viewers are willing to watch videos of that length on any channel. Advertisers who have shorter videos should try slightly longer content.
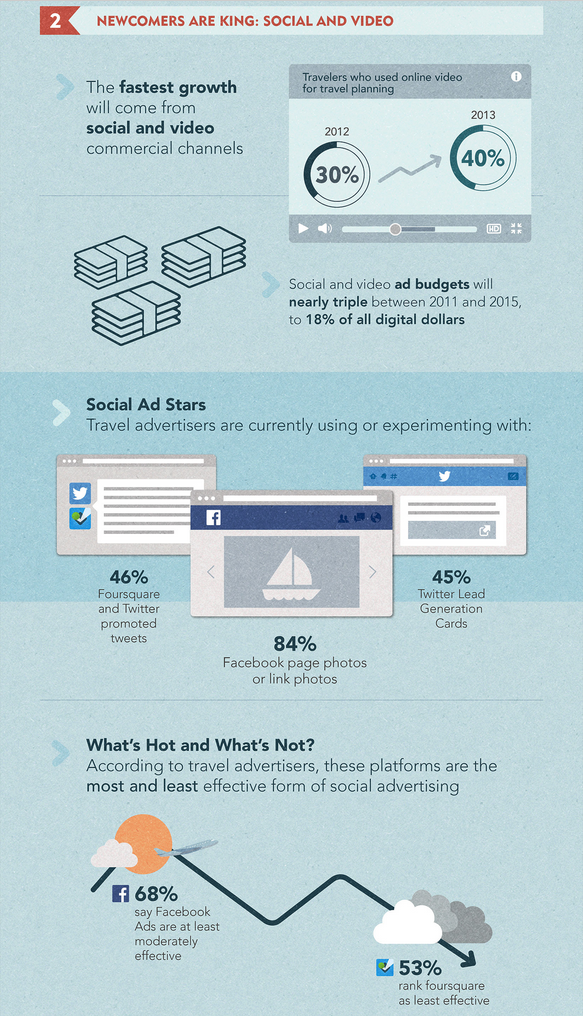
The final insight for this week is an infographic by Expedia Media Solutions with three major trends of the travel advertising industry. Most notable is the growth and effectiveness of social and video channels, both of which are expected to triple between 2011 and 2015, consuming 18% of all digital dollars. Facebook has emerged as the most effective form of social advertising; video is becoming increasingly important in consumer travel planning. We recommend that advertisers experiment with the relatively new Facebook video ads, especially advertisers in the travel industry.
Check back every week for more insights and trends on advertising!
The Social.com Advertising Benchmark report is here! Download the report on our website.


