

Get your FREE 30-day trial.
Please complete all fields.

A big part of any company’s social transformation is figuring out what metrics you’re going to track and how to create visibility for the best and worst performing teams. Having a compelling dashboard will help you gain executive support and it is a great way to make the broader organization feel accountable for driving metrics related to the product line.
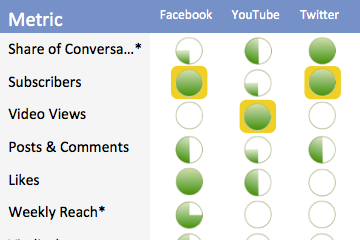
The first step is to look at what data is available. The list below is by no means complete, but it is enough to spark the conversation. The green bubbles represent the degree to which each metric does a good job of tracking success for that channel. The orange boxes represent the metric we thought did the best job of encapsulating success for that channel.

As you can see, when we go through and rate the effectiveness of each metric two challenges emerge.
At the highest level, here at salesforce.com we believe that share of conversation is the most important social media metric. Everything we do in marketing shapes share of conversation and it is a barometer of how successful we are at extending our reach.

We watch share of conversation closely, but it is a tricky metric. Most people don’t yet understand it and it is hard for an individual to feel like they’re accountable when it is hard to move the needle.
In the end we decided there were three metrics we wanted to really highlight to drive our Salesforce Marketing Social Enterprise Transformation.
Subscribers: This includes our fans and followers on Facebook, Twitter, YouTube, and LinkedIn. This is a concept everyone can understand and it is visible just by visiting the channel. We look at it as building our “social heart of marketing.” It is equivalent to collecting email addresses, but in many ways, even more valuable.
Video Views: For us this is a good proxy to measure if our content is being consumed. We’ve made a huge investment in video because it allows us to deliver a clear and concise message in a format that is easy to share. When we survey recent customers it has a huge impact on shaping purchase decisions and helping them successfully implement our products. We realize that we need to think of ourselves as a media company with the goal of attracting new audience and getting them to come back for more.
Blog Visitors: When we looked at the different models for driving pipeline from social, blogs were big. It is a half-step away from your website and a great way to garner inbound links. It is also content that will help us fuel our other social channels.
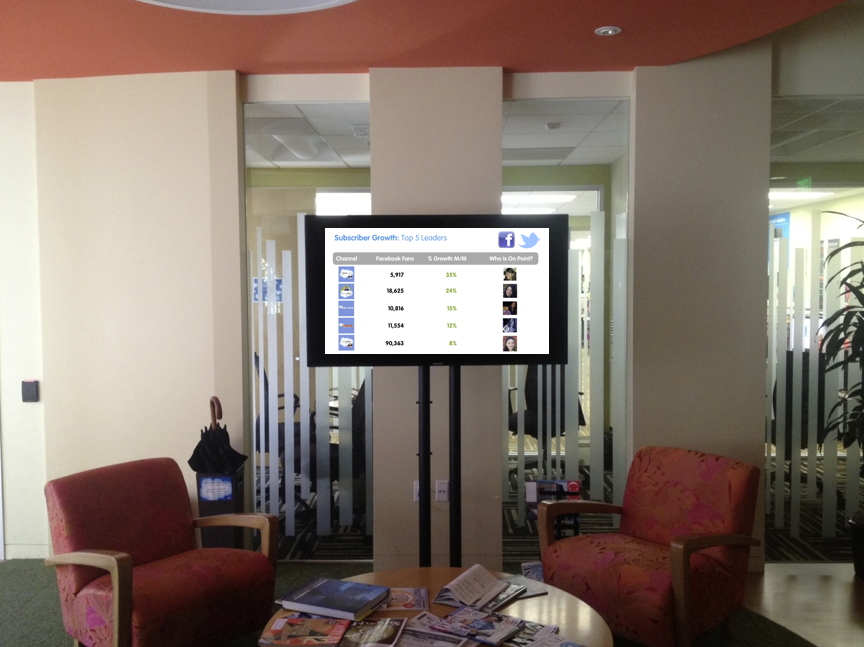
So those were the three metrics we ultimately chose to rally our marketing organization around social. The other big reason these three metrics stood out is because we could track them down to the team and sometimes down to the individual level. For example, we can stack rank our Facebook pages and highlight which ones are growing the fastest month over month.
In addition to the dashboards inside Salesforce, we’ve also dropped these metrics into a slideshow loop projected on TVs across the office. The video shows screenshots, pictures of individual contributors, and examples of success stories to really get people fired up.

In the next blog post in this series we’ll dive deeper into just how our dashboard was created and what it looks like. If you’ve got thoughts on social media metrics that have worked well for your team or if you have a story about how you’ll using data to get everyone involved, please share it as a comment below.


