


Get your FREE 30-day trial.
Please complete all fields.
When we launched the Q1 Shopping Index in April of this year, we were in the midst of the initial U.S. lockdowns. At this point, the data we observed was shocking. A surge of demand, via digital, across retail and consumer goods was taking grip as many brick-and-mortar store closures took place nationwide. We asked ourselves, were consumers overcorrecting for the loss of brick-and-mortar and would Q2 usher in “normalcy”? But we saw by the end of the second quarter that “normal” never returned. Unprecedented demand online, even greater than a typical holiday season, sustained throughout Q2 with record traffic, conversion, and spend.
Here are the top three trends that gripped consumers in Q2:
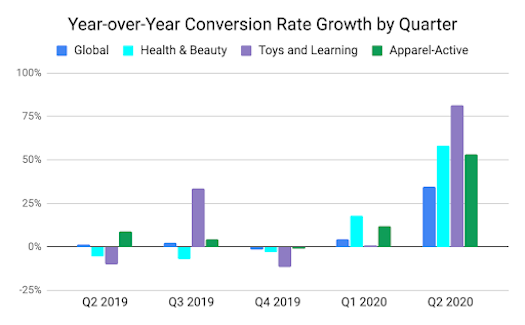
During a previous normal period, when we experience large increases in traffic (like during the holiday shopping season), conversion rate (traffic/orders) typically dips below the benchmark. But if 2020 has taught us anything, it’s that expectations are not always reality. The second quarter officially bucked this trend. Despite seeing an impressive 37% YoY increase in digital traffic over Q2 2019, conversion rates across all verticals experienced the largest gains in sales we’ve ever seen. Globally, shopping cart completes reached 3%, up 35% since last year’s Q2 conversion rate of 2.2%. Which type of consumers are the most likely to make their purchase? Health and beauty shoppers were clearly the most motivated in Q2, with sites in this sector seeing an impressive 4.1% checkout rate, up 58% from 2.6% in Q2 2019.
What does this mean? All these new digital consumers are shopping with a mission. They are worried about scarcity. They are ready to buy via digital channels — even in newer categories. To respond, you’ll need to make sure you’re pushing your brand to the edge and engaging shoppers on the platforms and devices they use the most. Be sure to optimize your site search experience to connect your shoppers to your products quickly and invest in artificial intelligence to provide highly personalized shopping experiences. And don’t forget the most important part — checkout. Make sure your checkout experience is optimized across all devices, especially mobile, with as few taps (or clicks) to purchase as possible.
The moral of the story is simple — shoppers are paying attention. Reward them with great experiences.
It’s rational to think digital sales would normalize as physical storefronts around the world started to reopen in May. However, the consumer has found the convenience of ecommerce too irresistible, and the growth we observed at the end of April continued for the entire second quarter. Global digital revenue in Q2 grew by an unprecedented 71% compared to the previous year and a singular metric didn’t drive this increase. Traffic (+37%), conversion (+35%), and spend (+34%) all experienced historic increases in Q2.
And despite some areas of the world reopening before others, digital growth continued to skyrocket in Q2 across all geographies we track in the Shopping Index. Australia and New Zealand (ANZ) experienced the greatest gains in digital spend (+140% over last year), followed by Canada (+111%), and the U.S. (+71%). As the summer months (or winter if you find yourself in the southern hemisphere) begin to heat up, digital spend shows no signs of slowing down anywhere.
What were shoppers spending their money on? Some of the highest growth was observed in toys and learning (+181%), health and beauty (+138%), and home (+134%) categories — “essential” merchandise when it comes to enduring a lockdown.
Will we eventually see digital revenue growth go back to “normal”? Yes, eventually growth will not be as aggressive as what we’re experiencing now. But this growth has set a new baseline. While there will likely be some leveling off, as happens after the holiday surge, consumer habits won’t snap back to the way they were. This dynamic sets the industry up for an interesting holiday, as retailers and brands attempt to forecast demand.
The ubiquity of mobile shopping and the recent surge in social engagement may lead to a lot of digital shopping visits, but that does not necessarily translate to purchases. But this was not the case in Q2. If we take a look at data from the Snapshot Research Series by the Salesforce Research team, 37% of survey respondents are online shopping “more than usual” and it’s clear from the increase in conversion rate that they came with a genuine intent to buy.
But they’re not just buying more via digital, the way they’re buying is changing too. Over 35% of Americans report that they prefer more contactless delivery options. And over 30% are utilizing buy online and pick up in store (BOPIS) more often than they ever have before. For brands and retailers embracing tactics like curbside pickup or BOPIS, the upside is tremendous. Sites advertising buy online or curbside pickup options saw digital revenues grow by 127% year over year. Meanwhile, sites that operate physical stores but did not offer a pickup option only grew by 54%. As self-service becomes more ubiquitous, and fulfillment challenges heat up again in the latter half of the year, self-service pickup options are going to be critical.
When it comes to heading back into the brick and mortar store, more people than ever are using self checkout and contactless payment options. Meanwhile, 13% of Americans are buying more products directly over social media platforms. Unsurprisingly, millennials are the most likely to be influenced by their social feeds, with over 63% of respondents from this generation reportedly buying a product over social media since the pandemic’s onset. In fact, purchases from a social channel referral saw the biggest increases in Q2, growing 104% across the entire industry.
What does this mean for the future of commerce? If there is one thing we know from almost a decade of analyzing consumer data, any surges in digital activity is always followed by a new baseline for digital commerce. As we look forward, this evolving consumer behavior will have a tremendous impact on major sales events slated for the second half of the year. How will shopper behavior change as the uncertainty of the pandemic continues into fall and holiday season? Stay tuned later this month when we will unveil our predictions for the holiday shopping season. To learn more check out the Salesforce Shopping Index, or view a pdf in a new browser window.
The Q2 Shopping Index uncovers the true shopping story through analyzing the activity of more than one billion shoppers across more than 41 countries powered by Commerce Cloud, with a focus on key 10 markets: U.S., Canada, U.K., Germany, France, Spain, Japan, Netherlands, Australia/New Zealand, and the Nordics. This battery of benchmarks provides a deep look into the last nine quarters and the current state of digital commerce. Several factors are applied to extrapolate actuals for the broader retail industry and these results are not indicative of Salesforce performance.