Get your FREE 30-day trial.
Please complete all fields.
Benchmark comparisons based on industry averages are an important indicator of the health of a brand’s business. Knowing how you stack up against your peers can inform business decisions that help you compete more effectively. But there’s a downside: “average” metrics sometimes over-simplify the health of the system they represent.
Why? We all intuitively think that “average” is “mid-point” with data distributed evenly on either side. Especially when comparing our site’s performance with a peer group like same-vertical sites; i.e. a luxury brand benchmarking against other luxury brands.
While averages provide a good starting point, we should be looking at distribution of values over a range to understand and compare performance in a peer group of similar brands.
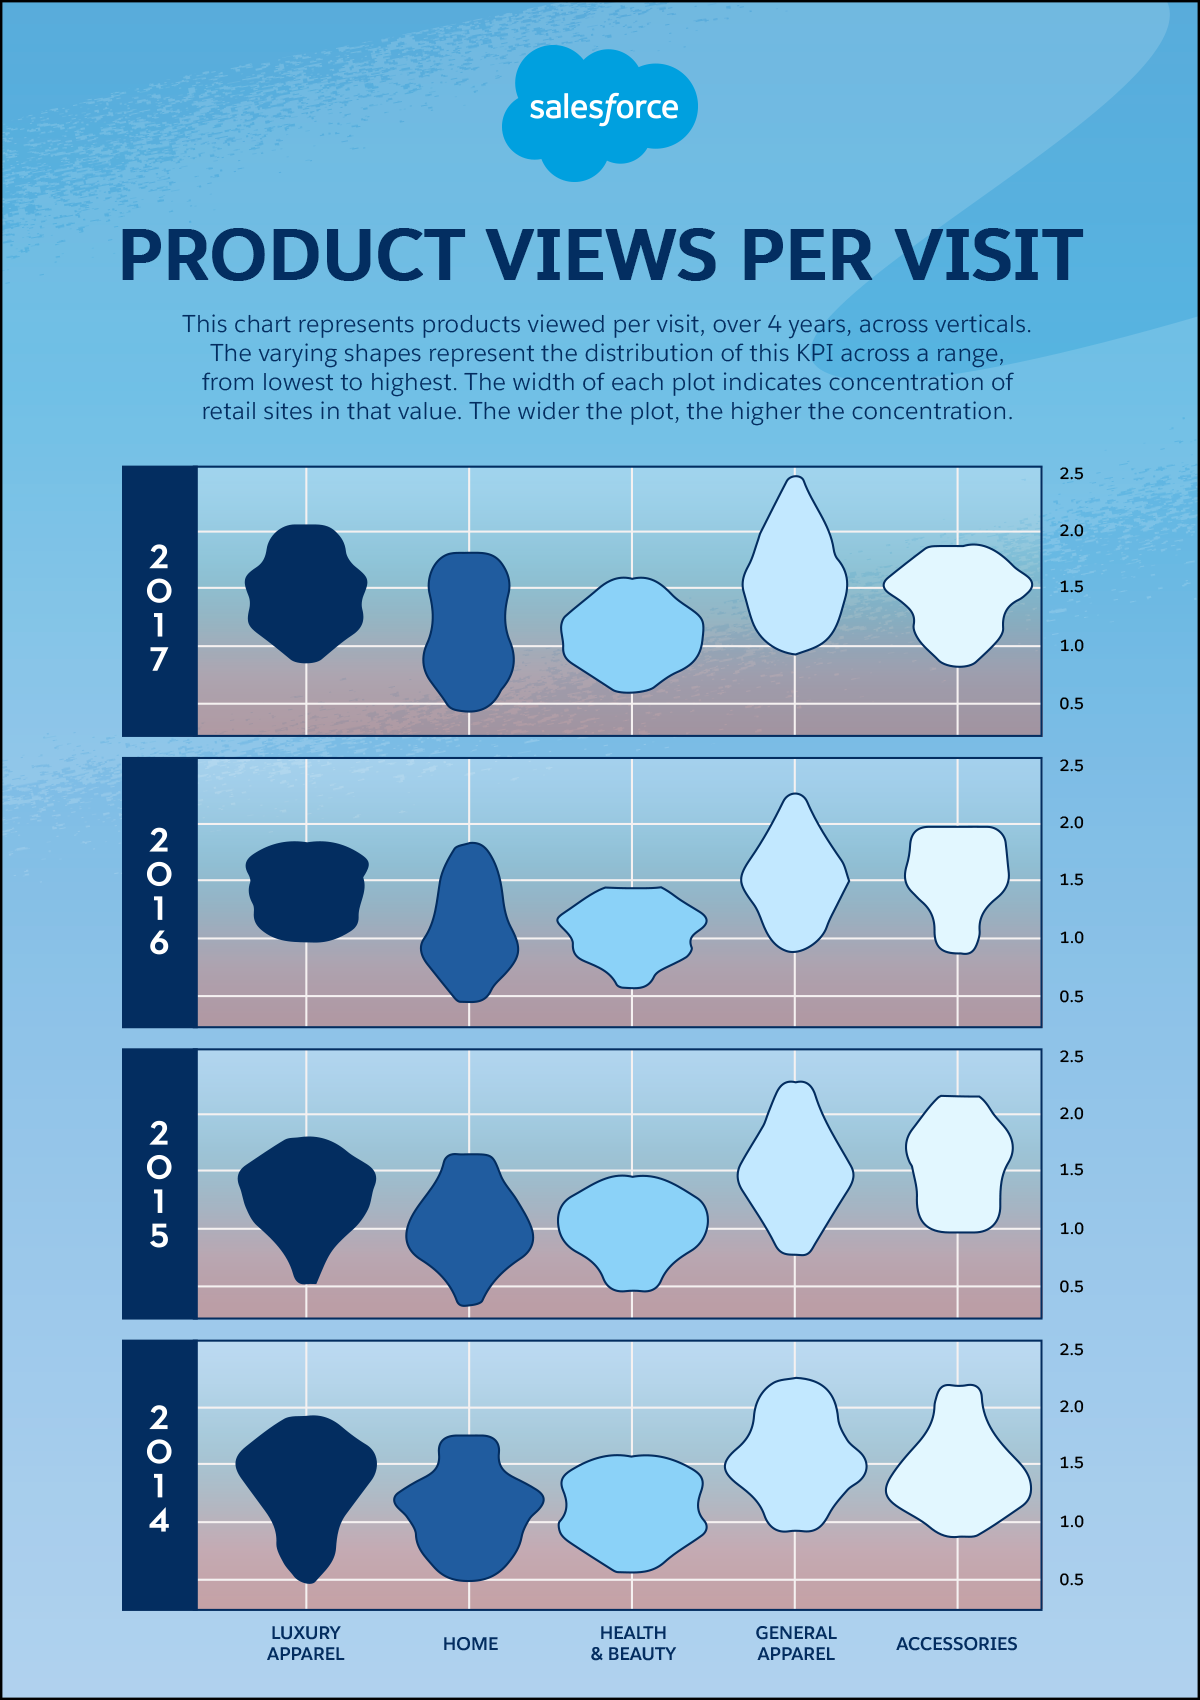
We analyzed data across more than 2,000 North American and European sites over a four-year period primarily in this manner. We found, not surprisingly, that the shopper journey has evolved, but that each step within that journey has evolved differently over the years for different verticals.
The ultimate goal of this exercise is to help you optimize your shopper’s journey to be as efficient as the best-in-class sites in your industry and, perhaps, to help prioritize investments to improve where you might be falling short.
In this, the first in a series of deep dives into the most important digital commerce KPIs, we examine Product Views Per Visit.
Product View Rate is defined as the average number of product pages viewed by a visitor, as seen in conjunction with non-product pages on the site. This is important because this is the first signal of true buying intent in a shopper’s journey. While one or two product views in a visit may not seem like a lot, it is indicative of a couple of trends in the industry – that shoppers are visiting more but spending less time with each visit, and with each visit they are satisfying their curiosity in a targeted manner, hence giving out clearer buying signals.
What this chart tells us
Product views are the first clear signal a shopper sends of her buying intent. As with any journey construct, this first step lays the foundation of their shopping experience on the site. Next week, we will look at another shopping signal that follows product views – adding a product to the shopping cart. Stay tuned!
In the meantime, check out our quarterly Shopping Index, which analyzes the shopping activity of hundreds of millions of global shoppers.