


Get your FREE 30-day trial.
Please complete all fields.
A few years ago, Harvard Business Review asked a single question to best-in-class companies ― “What is the greatest barrier to improving customer experience in your organization?”
Today, we live in the Age of the Customer where every organization should be asking this question. This is because customers with the best experiences generate more value for companies — in fact, roughly2.5x more value.
In the HBR study, the answer to the question was more revealing than the researchers expected. They learned that it wasn’t a lack of leadership, lack of line-of-business skills, or even cultural resistance that were the primary issues. All data pointed to organizational silos being the greatest barrier to high-quality customer experience. The lessons became clear: Break down silos to improve collaboration and get everyone on the same page to success.
Delivering customer experience in the Age of the Customer is a messy organizational challenge. With customer signals coming from websites, devices, social media, applications, and throughout marketing, sales, finance, and service, it’s not just the integration of data that is needed — it’s the integration of insights across business functions. With so much volume and variety of data, and the customer experience touching so many teams, it’s painfully easy to get bogged down in spreadsheets and pivot tables — not to mention struggling with complexities like duplicate data, varied definitions, and different conclusions that can upend customer initiatives.
At Salesforce, analytics became the vehicle of choice to improve departmental collaboration. The focus: Break down silos to take the customer's experience further. In fact, as you’ll see, collaboration is one of the biggest untold benefits from analytics. Itenables employees to be on the same page when it comes to the core data and metrics that drive a company’s most critical decisions.
Srinivas Vemuru is part of the Salesforce team that focuses on driving analytics initiatives. Vemuru manages analytics for Marketing Operations at Salesforce and has spent 15 years working with Fortune 500 companies. One of Vemuru’s goals has been to make Salesforce’s data warehouses for sales, marketing, and financial reporting accessible to more of the team across all functions, from product line owners to campaign managers.
The data warehouse had hundreds of tables and hundreds of millions of rows of data; therefore, reporting had grown to be an impediment to timely customer insights. Oftentimes, ad hoc analysis would take hours just to run a few simple reports. The result was that businesses often used spreadsheets to fill the gap, creating different and multiple versions of the data, separated metrics, and individual departmental reports that were difficult to agree on.
Vemuru’s focus was twofold. First, use Analytics Cloud to add a layer of consistency for ad hoc analysis. Consistency was incredibly important so everyone could speak the same language by using the same data sources, thus one definition of the metrics and insights. Another focus was to get a complete perspective of customer experience across the funnel. “We always measure everything through a funnel — how many people come to our website, how many convert to leads, how many of those convert to opportunity, and how many convert to customers,” said Vemuru.
Many organizations, when beginning a project like this, start with the data, but Vemuru decided to start this project by focusing on the core company metrics. First, he defined the high-level corporate metrics and created a basic standard definition of everything from annual contract value (ACV) to sales pipeline. “One of the major exercises we did when we were implementing Analytics Cloud was to partner with marketing, sales, and finance, and say that rather than building out one dataset and our own definitions of pipeline and bookings and ACV, we want to ensure that there would be a single definition for it, and everybody would use the same dataset,” he said.
The tactic for getting the metrics aligned to the corporate metrics at the departmental level was to embed one of Vemuru’s team members within each department. Marketing was one of the first departments. He did this so that his team could see how reports were being used, and how the line of business used the data. Vemuru summarizes the strategy: “The idea when we built this was to gather and agree on two different kinds of metrics. One, more enterprise-level metrics, where they are common across Salesforce, and one which is more departmental-specific.”
The result was an Analytics Cloud dashboard and framework with three levels of cascading metrics — corporate, departmental, and operational drivers. This framework created vertical and lateral alignment between teams, which was key to breaking down silos across the company.
Another important benefit of collaboratively defining metrics and getting everyone on the same page has been employee engagement. There has been a consistent 200% year-over-year growth in analytics usage. Measuring monthly active users (MAU) has been the key metric to monitor usage. Engagement MAU spikes indicate success for each Analytics Cloud line-of-business deployment, and spikes have occurred in finance, marketing, and service. Most recently, an updated rollout of rep and manager dashboards have been driving usage within the sales line of business.
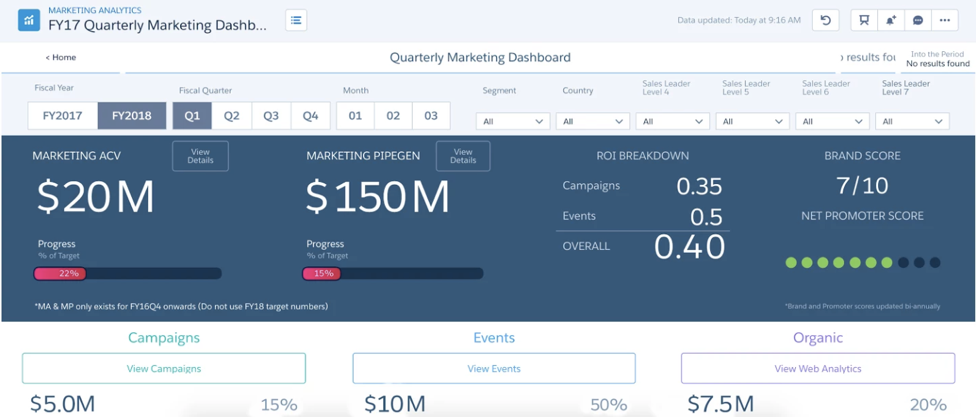
Quarterly Marketing Dashboard
Training has been key. “We realized early that people are still reluctant to give up spreadsheets, so we focused a lot on adoption. After they do it once, they can't believe it — and users will often come back. The result of focusing on adoption and training has resulted in a substantial uptick in use,” said Vemuru. With a focus on adoption, active users have increased to roughly 500 across the organization and 70 in marketing alone.
Another measure of adoption for analytics is how many reports and dashboards end users are creating. Successful analytics deployments show almost viral growth as line-of-business users start building analytics. “We want to have campaign managers and the marketers build their own dashboards,” said Vemuru. The growth has been significant, with 300+ reports, or lenses, being created with Analytics Cloud in the last year alone.
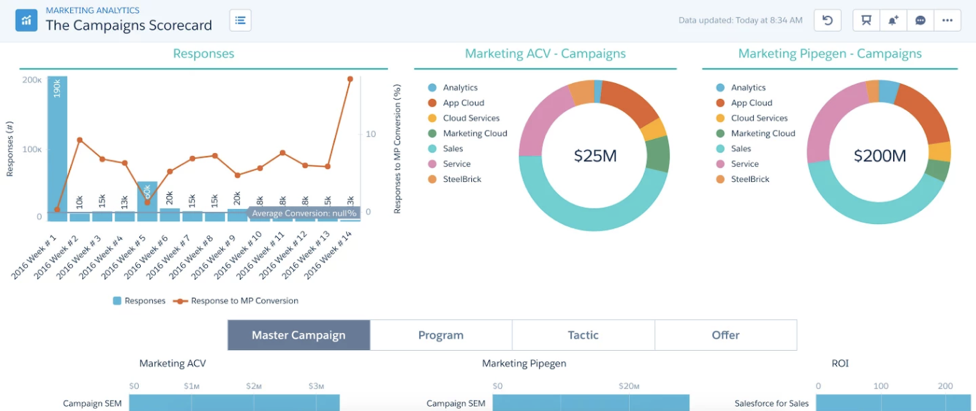
The Campaigns Scorecard
Shifting from inflexible production reports to self-service and using Analytics Cloud to improve query performance for ad hoc analysis have delivered significant increases in execution speed for the team. Analytics Cloud provides a key value that drives faster query performance than querying the data warehouse directly. Ad hoc queries, with hundreds typically occurring every day, have dropped from around 4–5 minutes a query to just seconds. A quick back-of-the-napkin calculation on time saved, on just 100 queries a day, nets out to about 160 hours a month, which is about 2,000 hours recouped across teams or about one working year.
Important takeaways from rolling out Salesforce analytics:
1. Have a good understanding of the data and build on key company metrics.
2. Standardize on corporate, departmental, and operational drivers.
3. Ensure lateral alignment across sales, marketing, finance, and service functions.
4. Get your analytics team embedded within the line-of-business functions.
5. Provide training and adoption and get users hands-on to break down barriers.
6. Measure adoption by monitoring user activity and content creation.
7. Don’t underestimate self-service and query speed as important adoption drivers.
To learn more about Analytics Cloud, watch the demo here.


