Get your FREE 30-day trial.
Please complete all fields.
Corporate real estate teams have more responsibility than ever. Beyond focusing purely on physical space, they’re increasingly tasked with enabling employee productivity and satisfaction. It’s about balancing cost, space utilization, and productivity. It’s also about optimizing the real estate portfolio, creating cost-effective spaces that match employee work patterns, and tailoring services to employee needs. This expanded agenda, and the influx of data that goes with it to optimize so many variables, can be both intimidating and time consuming.
At Salesforce, Shalaya Shipman, Senior Manager of Operations for Real Estate & Workplace, is leading the charge with analytics. With Salesforce having roughly 50 corporate locations globally and a track record as Fortune’s “Best Place to Work” nine years in a row, continually optimizing cost, productivity, and employee satisfaction is no small task. For the Real Estate and Workplace Services team, the employee is the customer, enabling Salesforce employees to be focused on the mission of enabling customer success.
Beginning last year, Salesforce upgraded its Corporate Real Estate team to be more analytics-oriented, which involved compiling eight different data sources across the organization, including multiple systems from lease administration, occupancy tracking, and employee satisfaction survey data from Service Cloud. “One of the big challenges [before] was just joining the sources together to get a complete perspective of a building,” said Shipman. The complex set of data sources, in many ways, reflects how real estate organizations have changed over the past few years: data flowing in from financial, building management, service, and employee survey sources.
Prior to deploying Analytics Cloud, Shipman’s team used spreadsheets to combine all the data. But creating manual reports took way too much time, involving extracting and combining data from so many systems — calculating KPIs for rentable square footage, building capacity, occupancy, vacancy, seat metrics, utilization, employee satisfaction, and case volume. Comprehensive utilization reporting took more than a week to pull together, multiple times a year. In addition, portfolio reporting to measure seat count across regions and locations took two days out of each week. It was a significant drag on time, but according to Shipman, the larger issue was that "the organization was being reactive, not proactive ― we couldn’t slice and dice data to uncover emerging issues before we faced them.”
For example, one of the issues was tracking vacancy in locations, especially those with no assigned seating. Prior to Analytics Cloud, the team used a spreadsheet model to estimate some aspects of vacancy, rather than pulling actuals from every source to get an exact figure because the data volume was so high. Yet, without the granular actuals, some locations on closer inspection were running at the ideal utilization rate — creating issues that could have been addressed sooner if only the data had been available.
Replacing spreadsheets with Analytics Cloud apps and dashboards has significantly changed things for the team. The first benefit has simply been freeing up time to focus on getting ahead of issues, rather than wasting time creating reports. By automating data integration flowing into Analytics Cloud and calculating metrics automatically, the Real Estate and Workplace Services team has freed up two days a week that were otherwise spent combining and cleaning data in spreadsheets. Over the course of a year, this works out to about 20 working weeks back to focus on more strategic projects.
The time saved, Shipman said, can be spent on more high-priority analysis and uncovering problems. And that’s where the ability to drill down into granular data helps. Shipman points out that “with Analytics Cloud, I can instantly look at a lease cost per seat and local market comparison to compare if it’s too high or low, and compare one location versus another.” But more importantly, the Real Estate team can drill down. “I can drill into New York, for example, and can see satisfaction, vacancy rates, and costs. And with that, I can proactively see if there is a way we can create a better work experience for our employees while optimizing cost at the same time.”
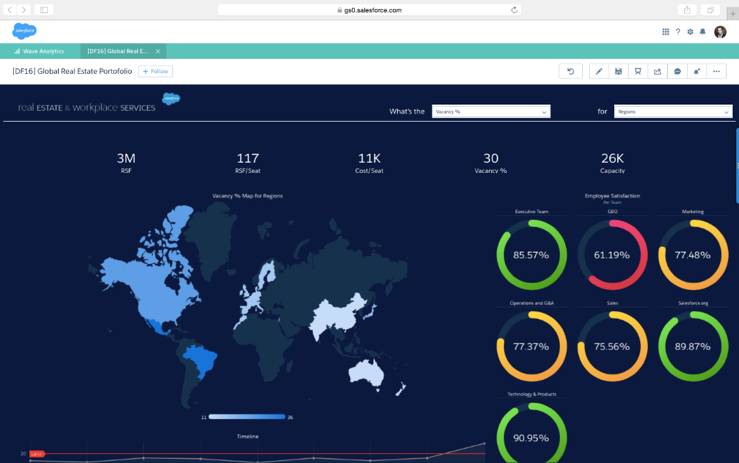
Example Dashboard: Global Real Estate Portfolio
Using Analytics Cloud, Shipman’s team has been able to address utilization crunches before they happen. “Our strategy team began to summarize detailed employee badge data to get ahead of utilization. Combined with employee and seat location information, we are now pushing millions of rows of data into Analytics Cloud and can track activity by region, city, building, and team,” she said.
Moving from spreadsheets has also enabled the team to be more transparent about metrics, with self-service analytics delivered to more than 200 users across the organization. Naturally, mobile access is an important facilitator for adoption in the real estate business, so Analytics Cloud’s iOS and Android apps have helped bolster further adoption, providing actionable analytics during site visits at the point of decision.
Thanks to a project that went from kickoff to launching its first dashboard within five weeks, the Real Estate team has seen significant impact. Shipman’s unveiled some helpful insights for success.
First, look to create a consolidated dashboard for your team and focus on the core metrics. Shipman advises to concentrate on 10 to 15 data points to ensure you don’t overwhelm users,- making it easy to digest.
Second, for reporting, move beyond assets and utilization to make reporting more people-centric. Incorporate metrics that include employee satisfaction measures in addition to cost measures to create a balanced perspective.
Third, it's all about the end users. Design dashboards with your users in mind. Make it simple to use the dashboards and understand the insights. In this case, executive leadership was ultimately the user group that needed simplicity to deliver success.
This is just one of many stories of how Salesforce is using analytics to drive productivity and business value to its employees. Analytics Cloud is taking the lead as a platform that is offering the native flexibility to connect complex data streams and build custom dashboards, while delivering actionability to help teams, like Corporate Real Estate, save time and money.
To learn more about Analytics Cloud, watch our overview video.