


Get your FREE 30-day trial.
Please complete all fields.
In the last 18 months there has been a seismic shift in both the entire digital and advertising landscapes. A few of the major shifts:
Mobile is further entrenching itself as the first screen; according to Yahoo, people spend more minutes per day on their mobile devices than watching TV.
In 2014, digital advertising has now surpassed both broadcast and cable television ad revenue in the US, reported the IAB, to be the largest single channel.
Social advertising spend is exploding. For example, the IAB reports that in the UK, social advertising (led by the likes of Facebook, Twitter, and LinkedIn) reached almost £1B in 2014 which is a staggering 65% year over year increase.
New advertising channels are emerging, including Instagram and Snapchat, with new ways to reach audiences at all stages of the marketing funnel.
Considerable consolidation is happening in the broader advertising technology ecosystem, including acquisitions and companies closing their doors.
The time for advertising, marketing, and broader CRM to sit in separate silos is ending. New technologies have emerged that create the ability to coordinate and measure efforts accurately across channels and allow a true omni-channel (and customer-centric) journey-focused strategy.
In this post, we focus on the major trends on all three platforms with aggregated data from Salesforce Marketing Cloud, including more than two trillion ad impression and 200 billion total ad engagements globally in Q4 2014 and Q1 2015.
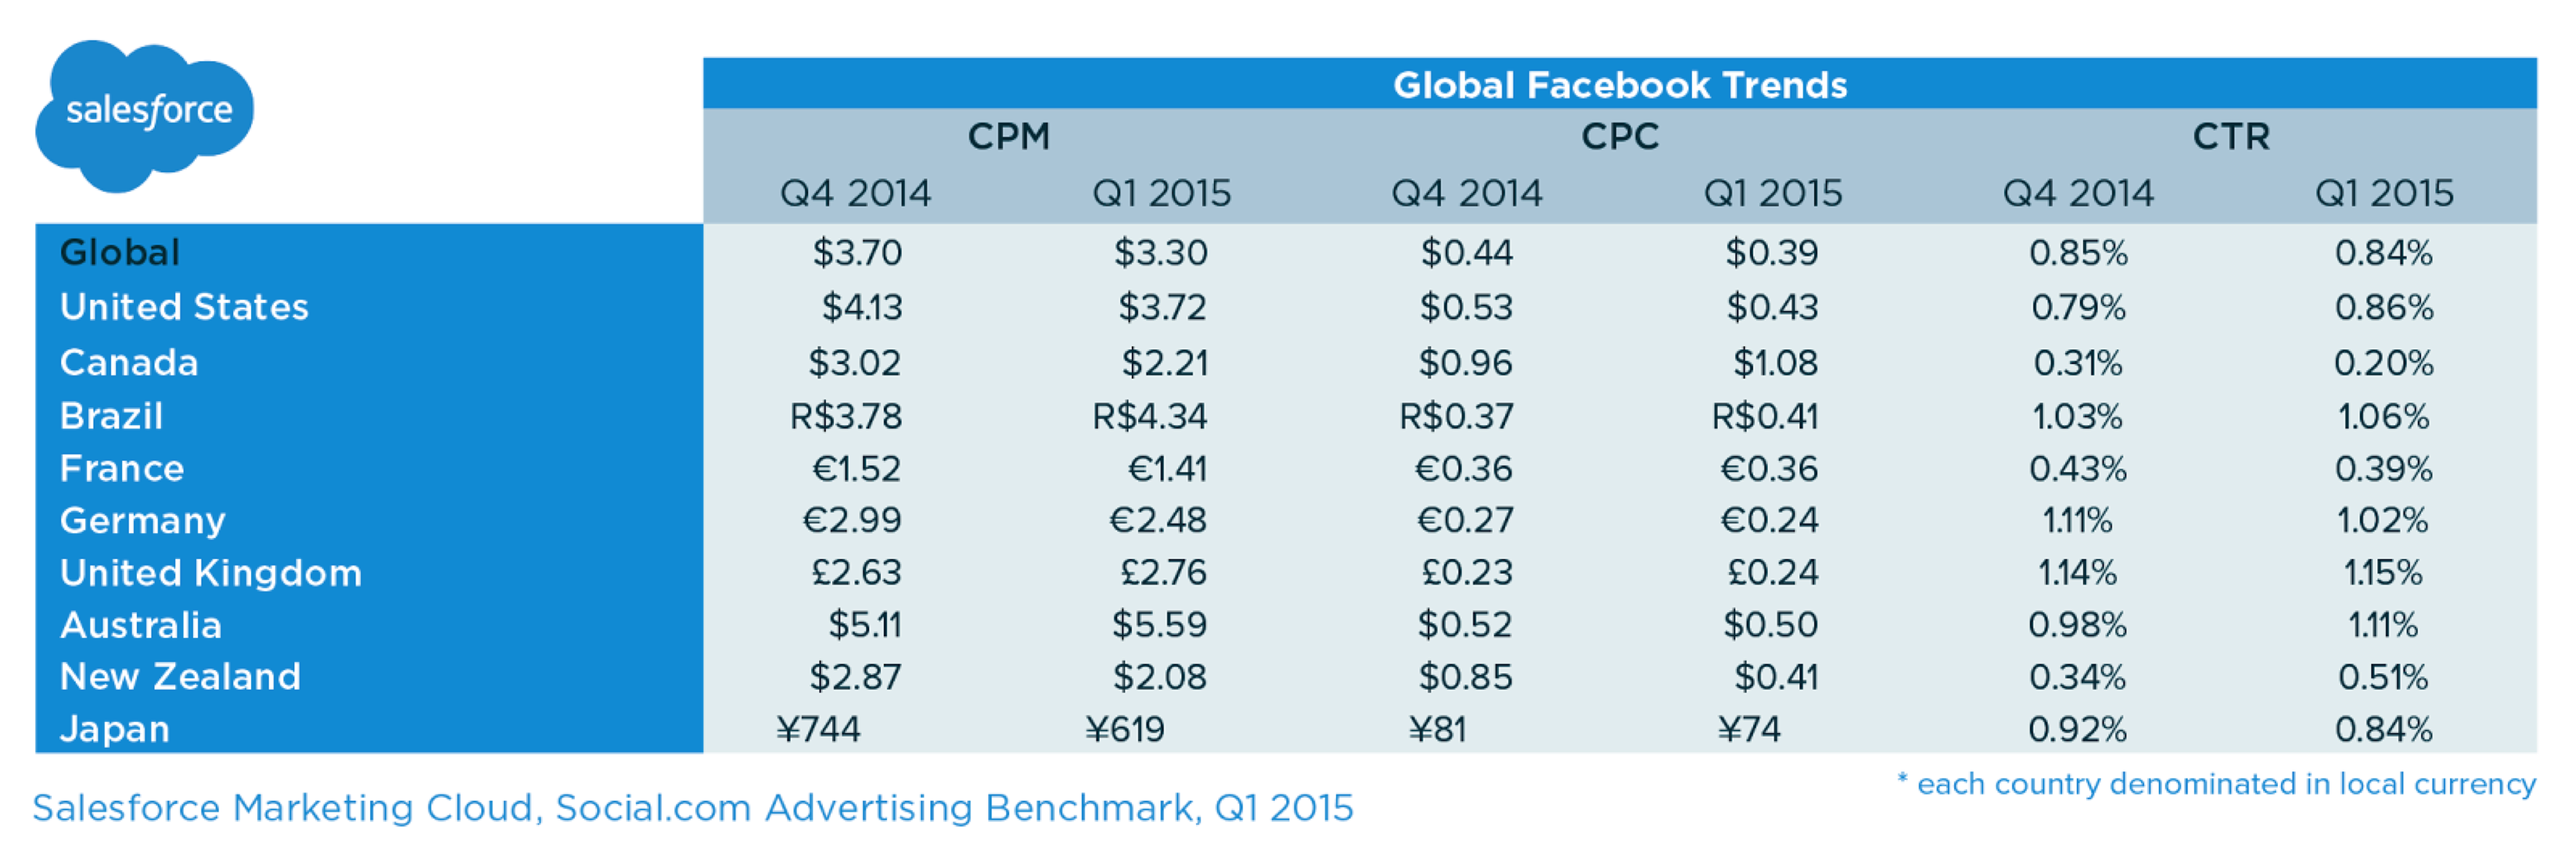
Globally, the overall CPM decreased by 11%, to $3.30. This reflects normal seasonal trends in digital advertising, with higher costs in Q4 due to advertiser demand for holiday advertisements. Facebook itself shows increased overall revenue in Q4 relative to Q1 both this year and last year in line with the overall advertising industry, as it has matured and become a major channel in digital advertising.
In the United States, the overall Facebook CPM decreased from Q4 to Q1, to $3.72. At the same time, CTR in the US increased to 0.86%, indicating a healthy engagement with the ads. Similar decreases in CPM were seen in multiple other countries, including France, Germany, and Japan. Ads targeting consumers in these countries, however, both showed a small decrease in CTR, and the CPCs declined relatively less than the CPMs.
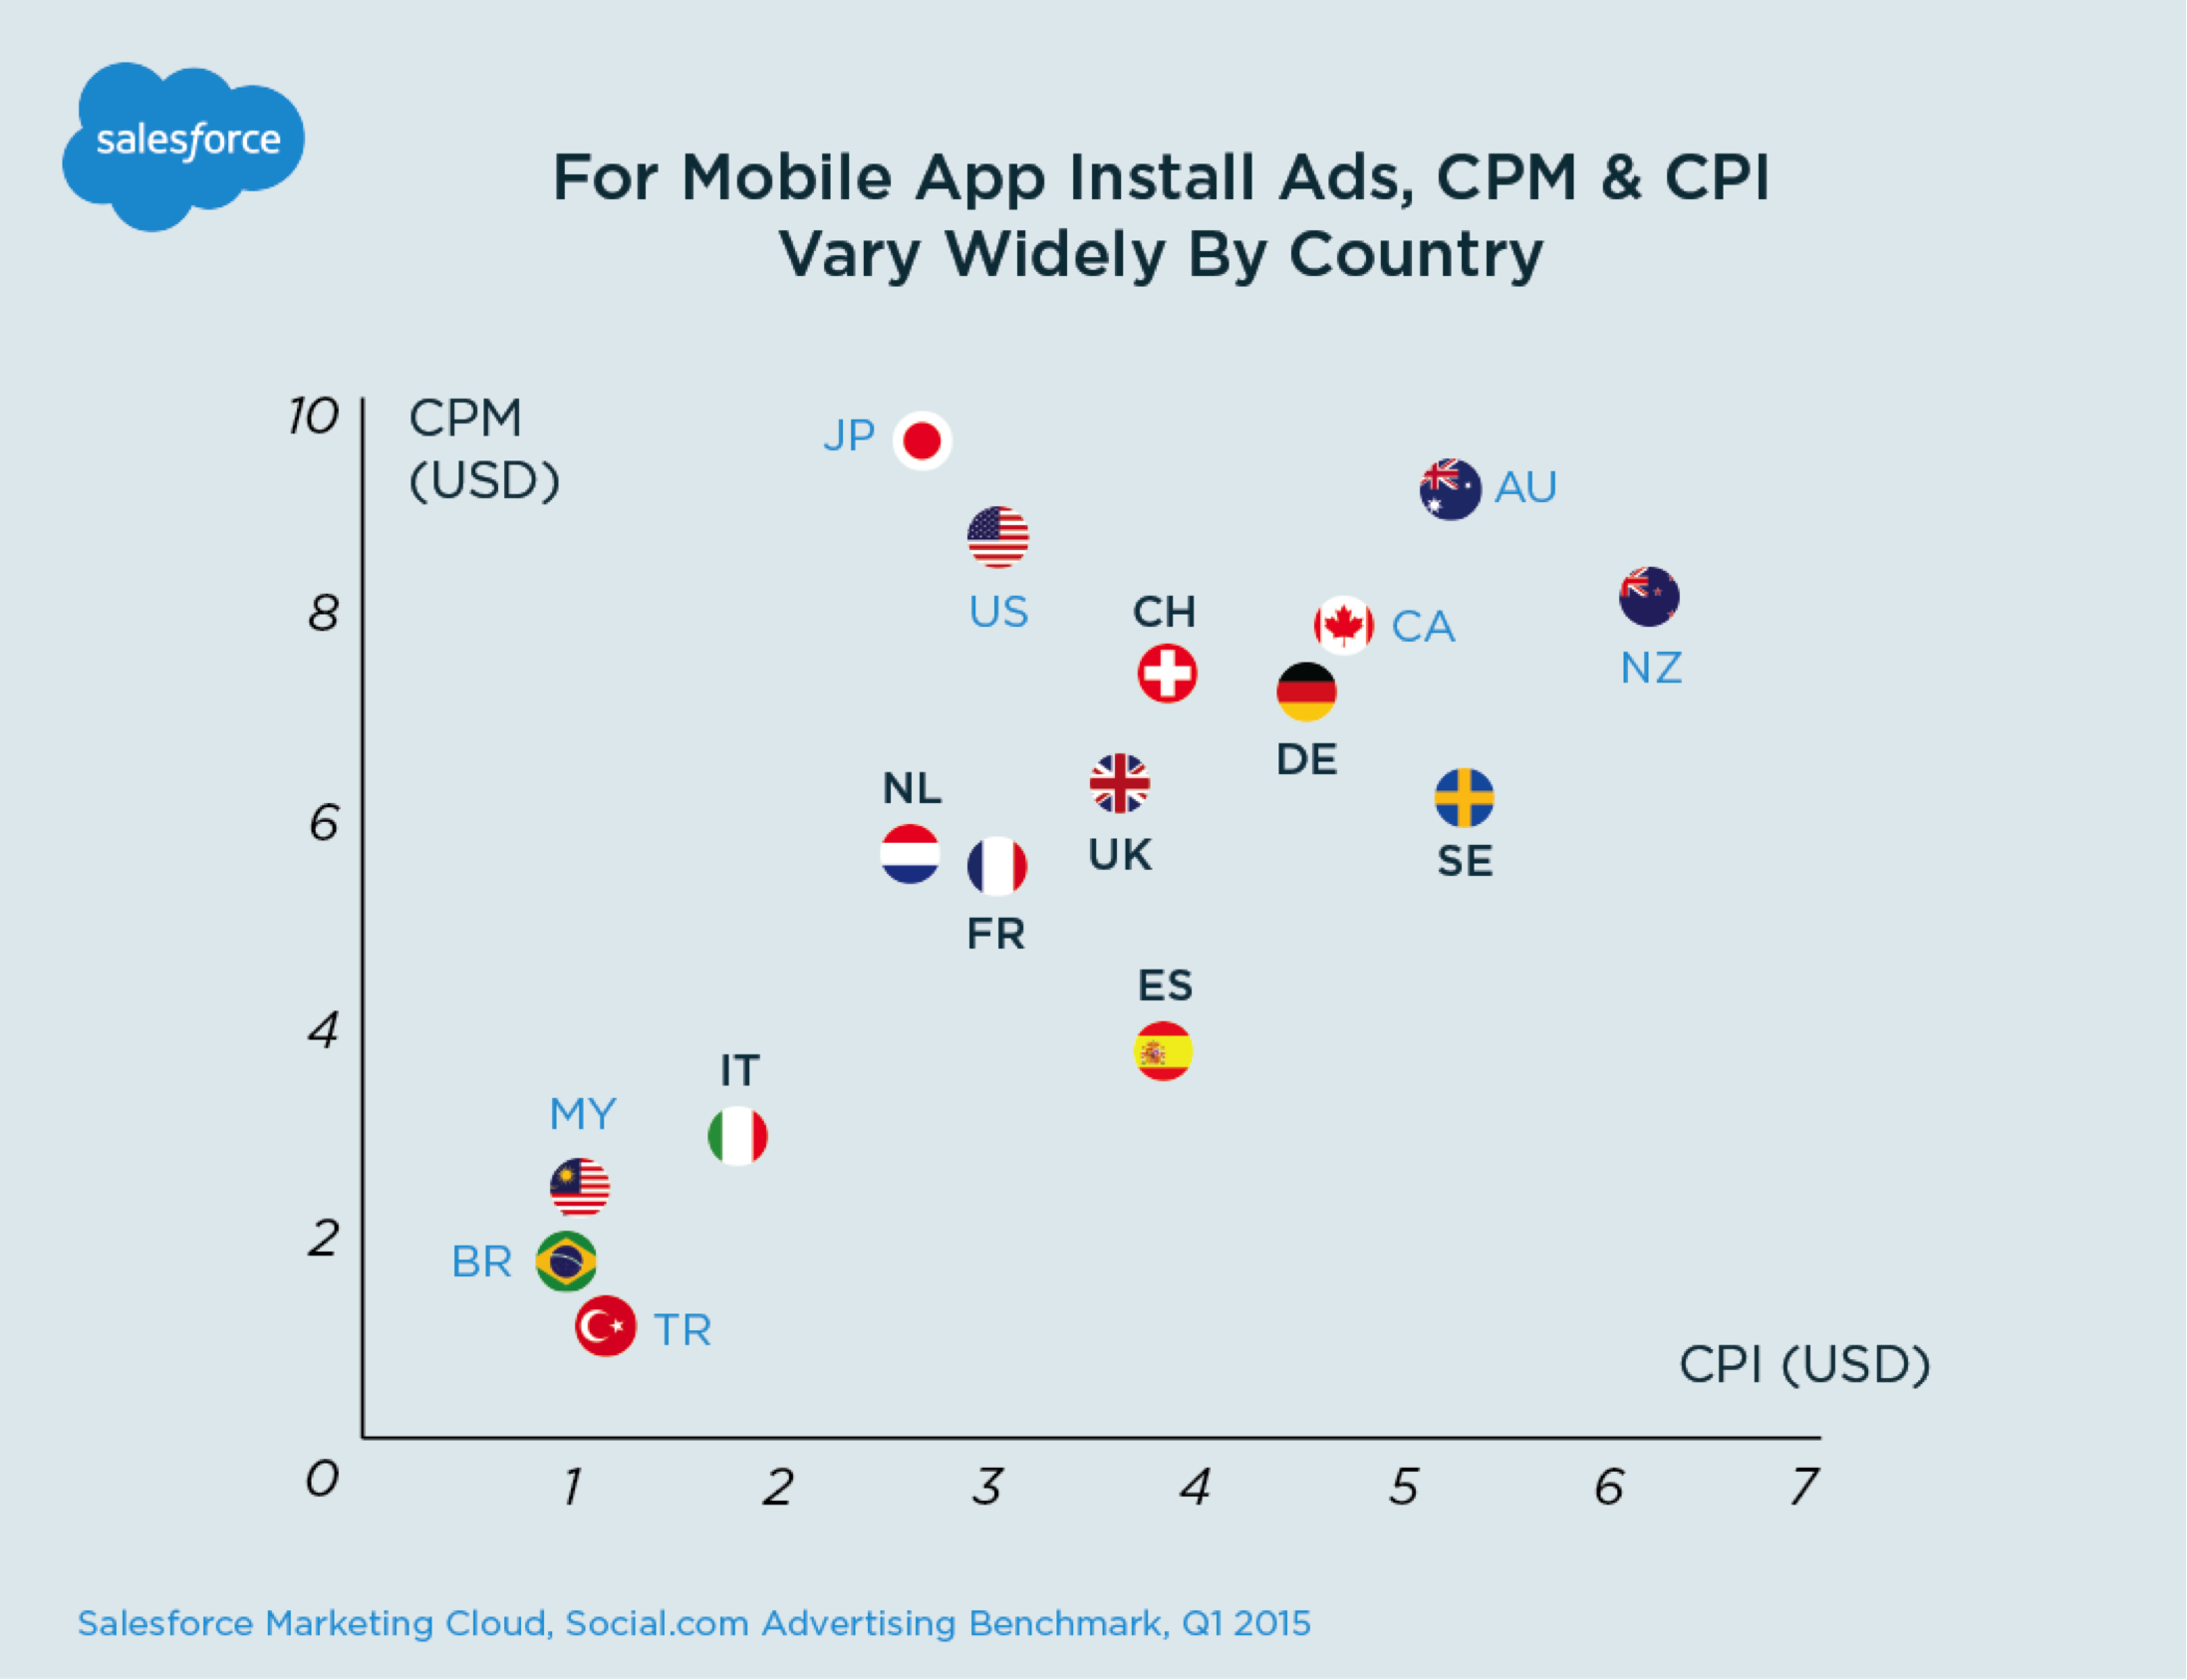
Mobile apps are a critical component of how consumers spend their time; according to Yahoo, 88% of the time that consumers spend on mobile devices is spent in apps, totaling 37:28 hours per month, according to Neilsen. Overall, New Zealand and Sweden were the most expensive countries to run mobile app install campaigns in Q1, at $6.16 and $5.28 respectively. After that is Australia ($5.22), Canada ($4.72), and then a cluster of European countries ranging from Germany to Spain. The United States ($3.04), and Japan ($2.79) follow.
Advertisers can examine what countries that they target with app install campaigns today, either within a given region or as a part of a larger global rollout, test if adding different geographies can produce better results.
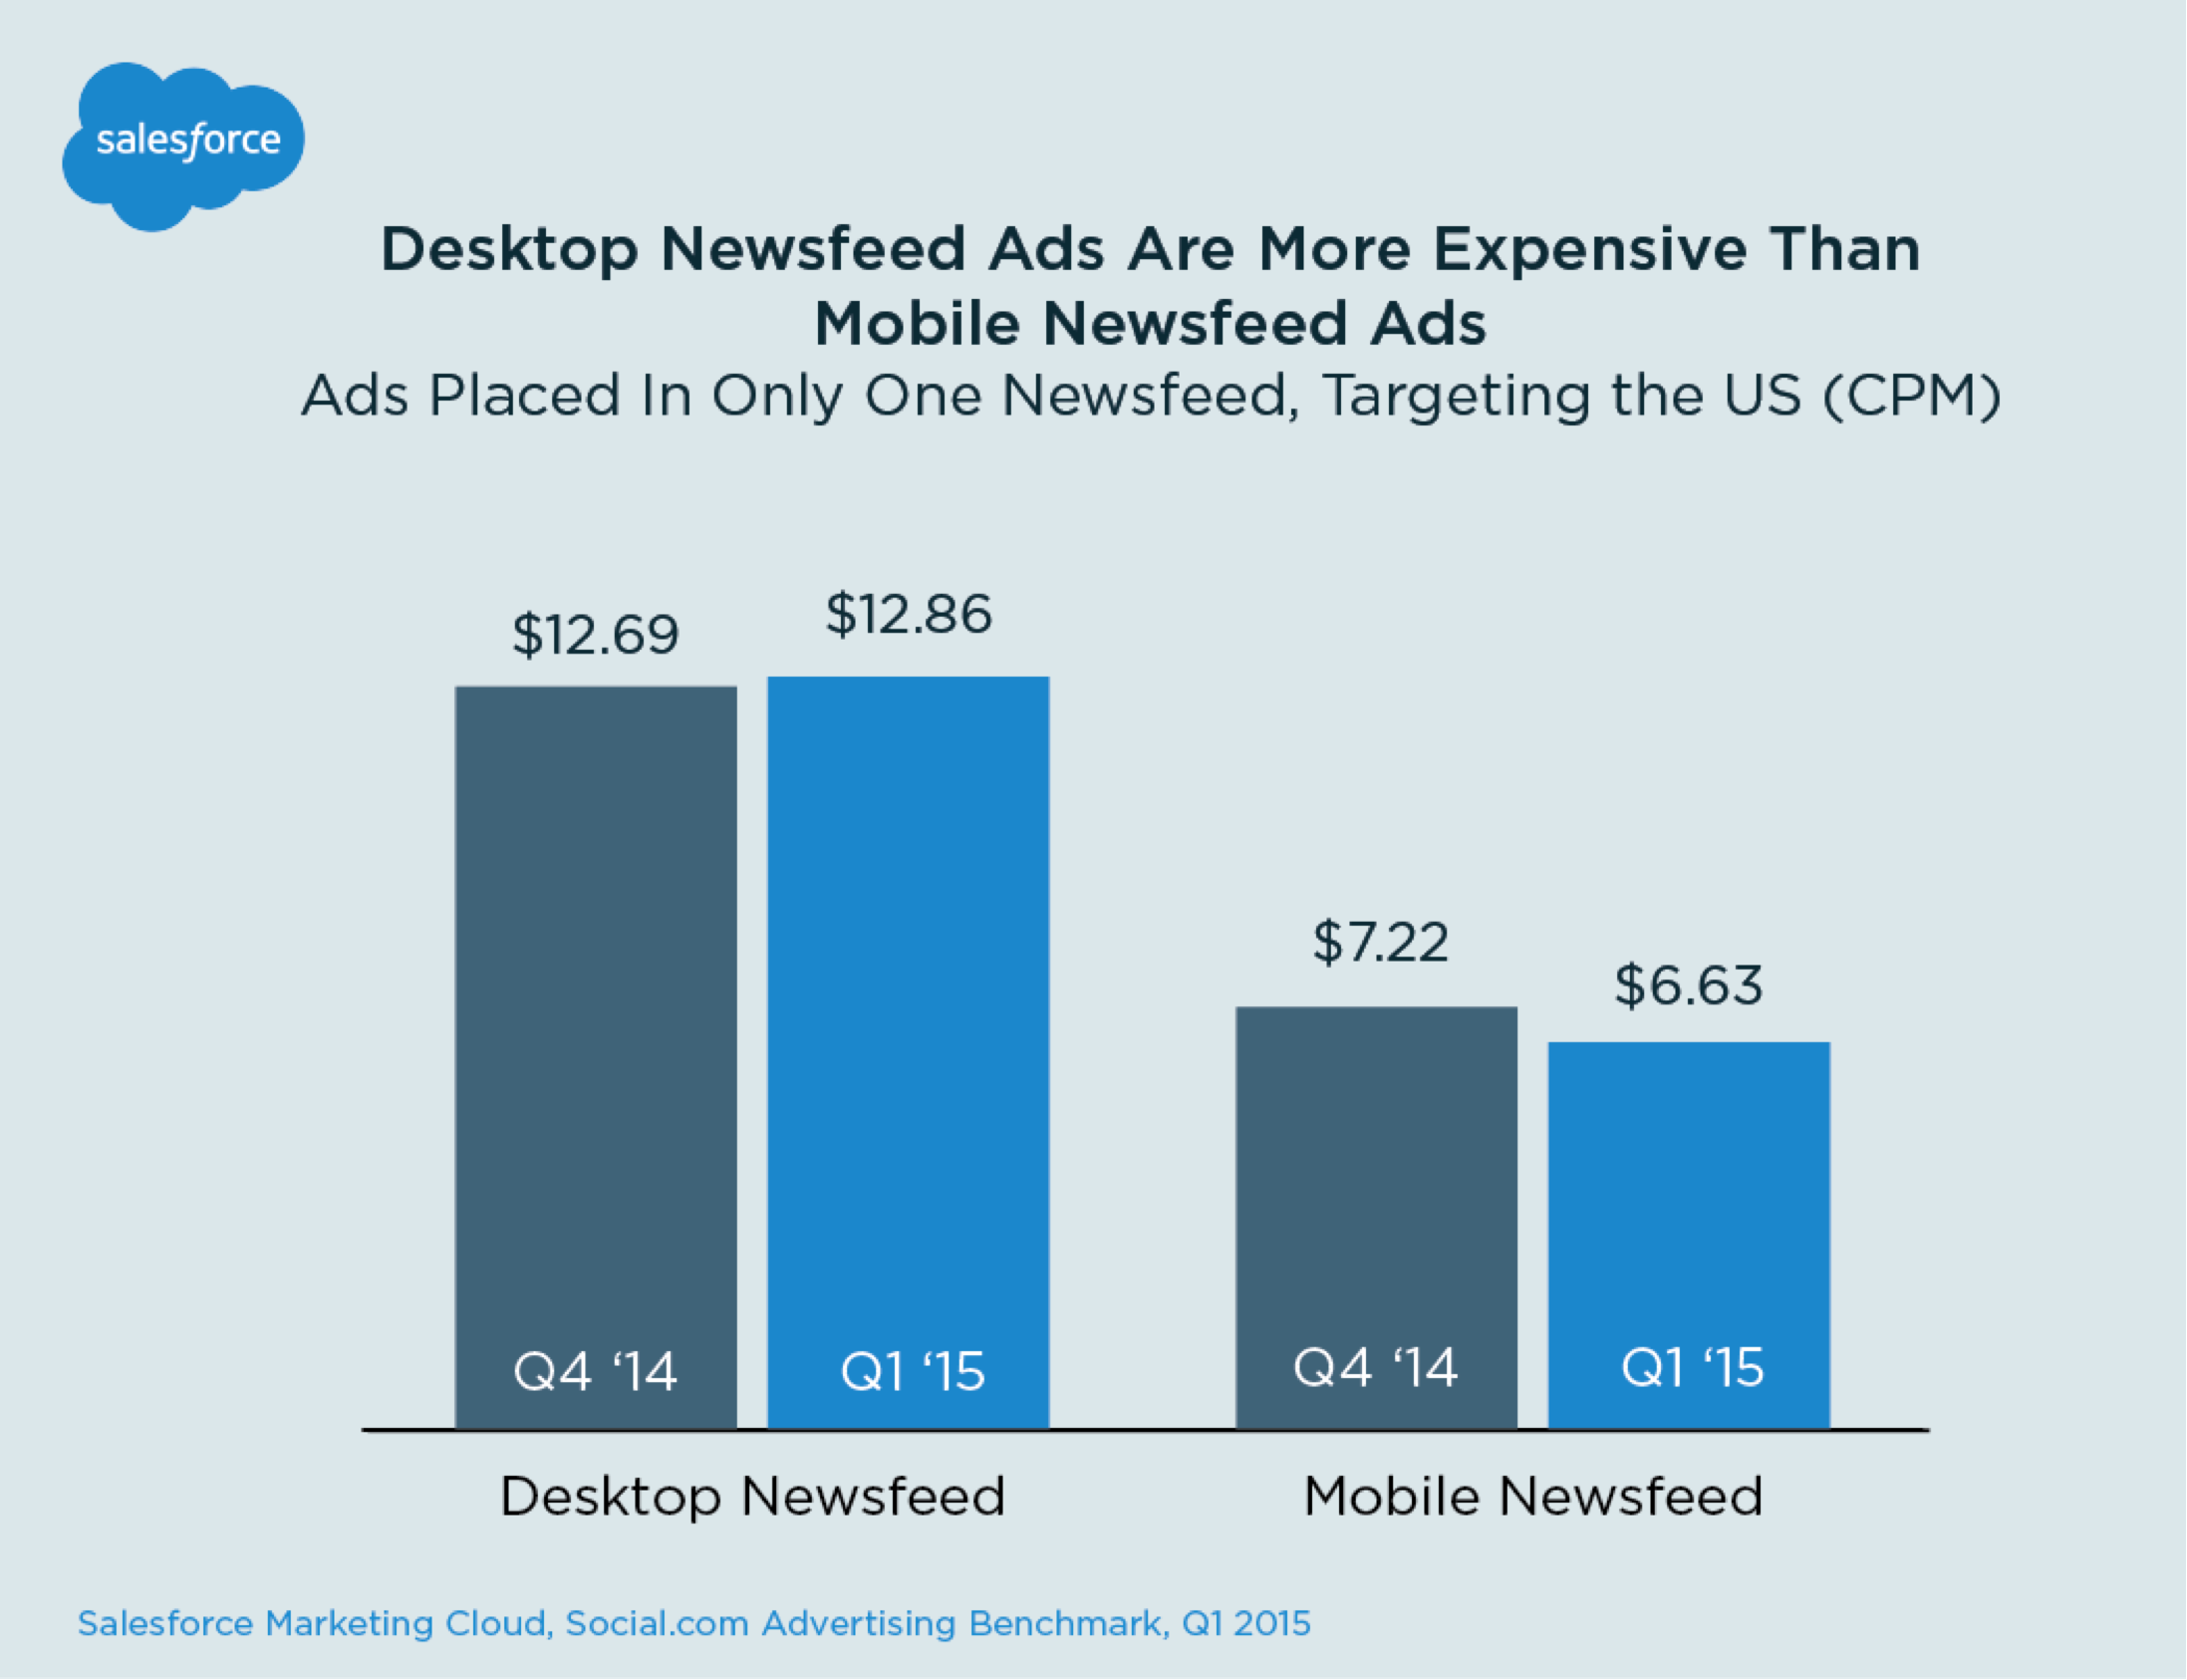
In both Q1, Desktop Feed CPM was much higher than Mobile Feed CPM in the United States. In Q4, Desktop Newsfeed CPM was $12.69 and Mobile Newsfeed CPM was $7.22. That gap further grew in Q1, with Desktop rising to $12.86 and Mobile actually decreasing to $6.63.
Consumers are increasingly spending time in Facebook on a mobile device, which increases the available inventory of impressions on mobile. Several types of advertisers still focus on desktop ads, including eCommerce companies which are still using traditional re-targeting solutions on Facebook that are desktop-only instead of the brand-new Dynamic Product Ads.
At the same time, the percentage of Facebook users who only use the desktop app continued to drop, reaching a low of 14.7% in Q1, down from 16.2% in Q4 and 24.1% in Q1 2014.
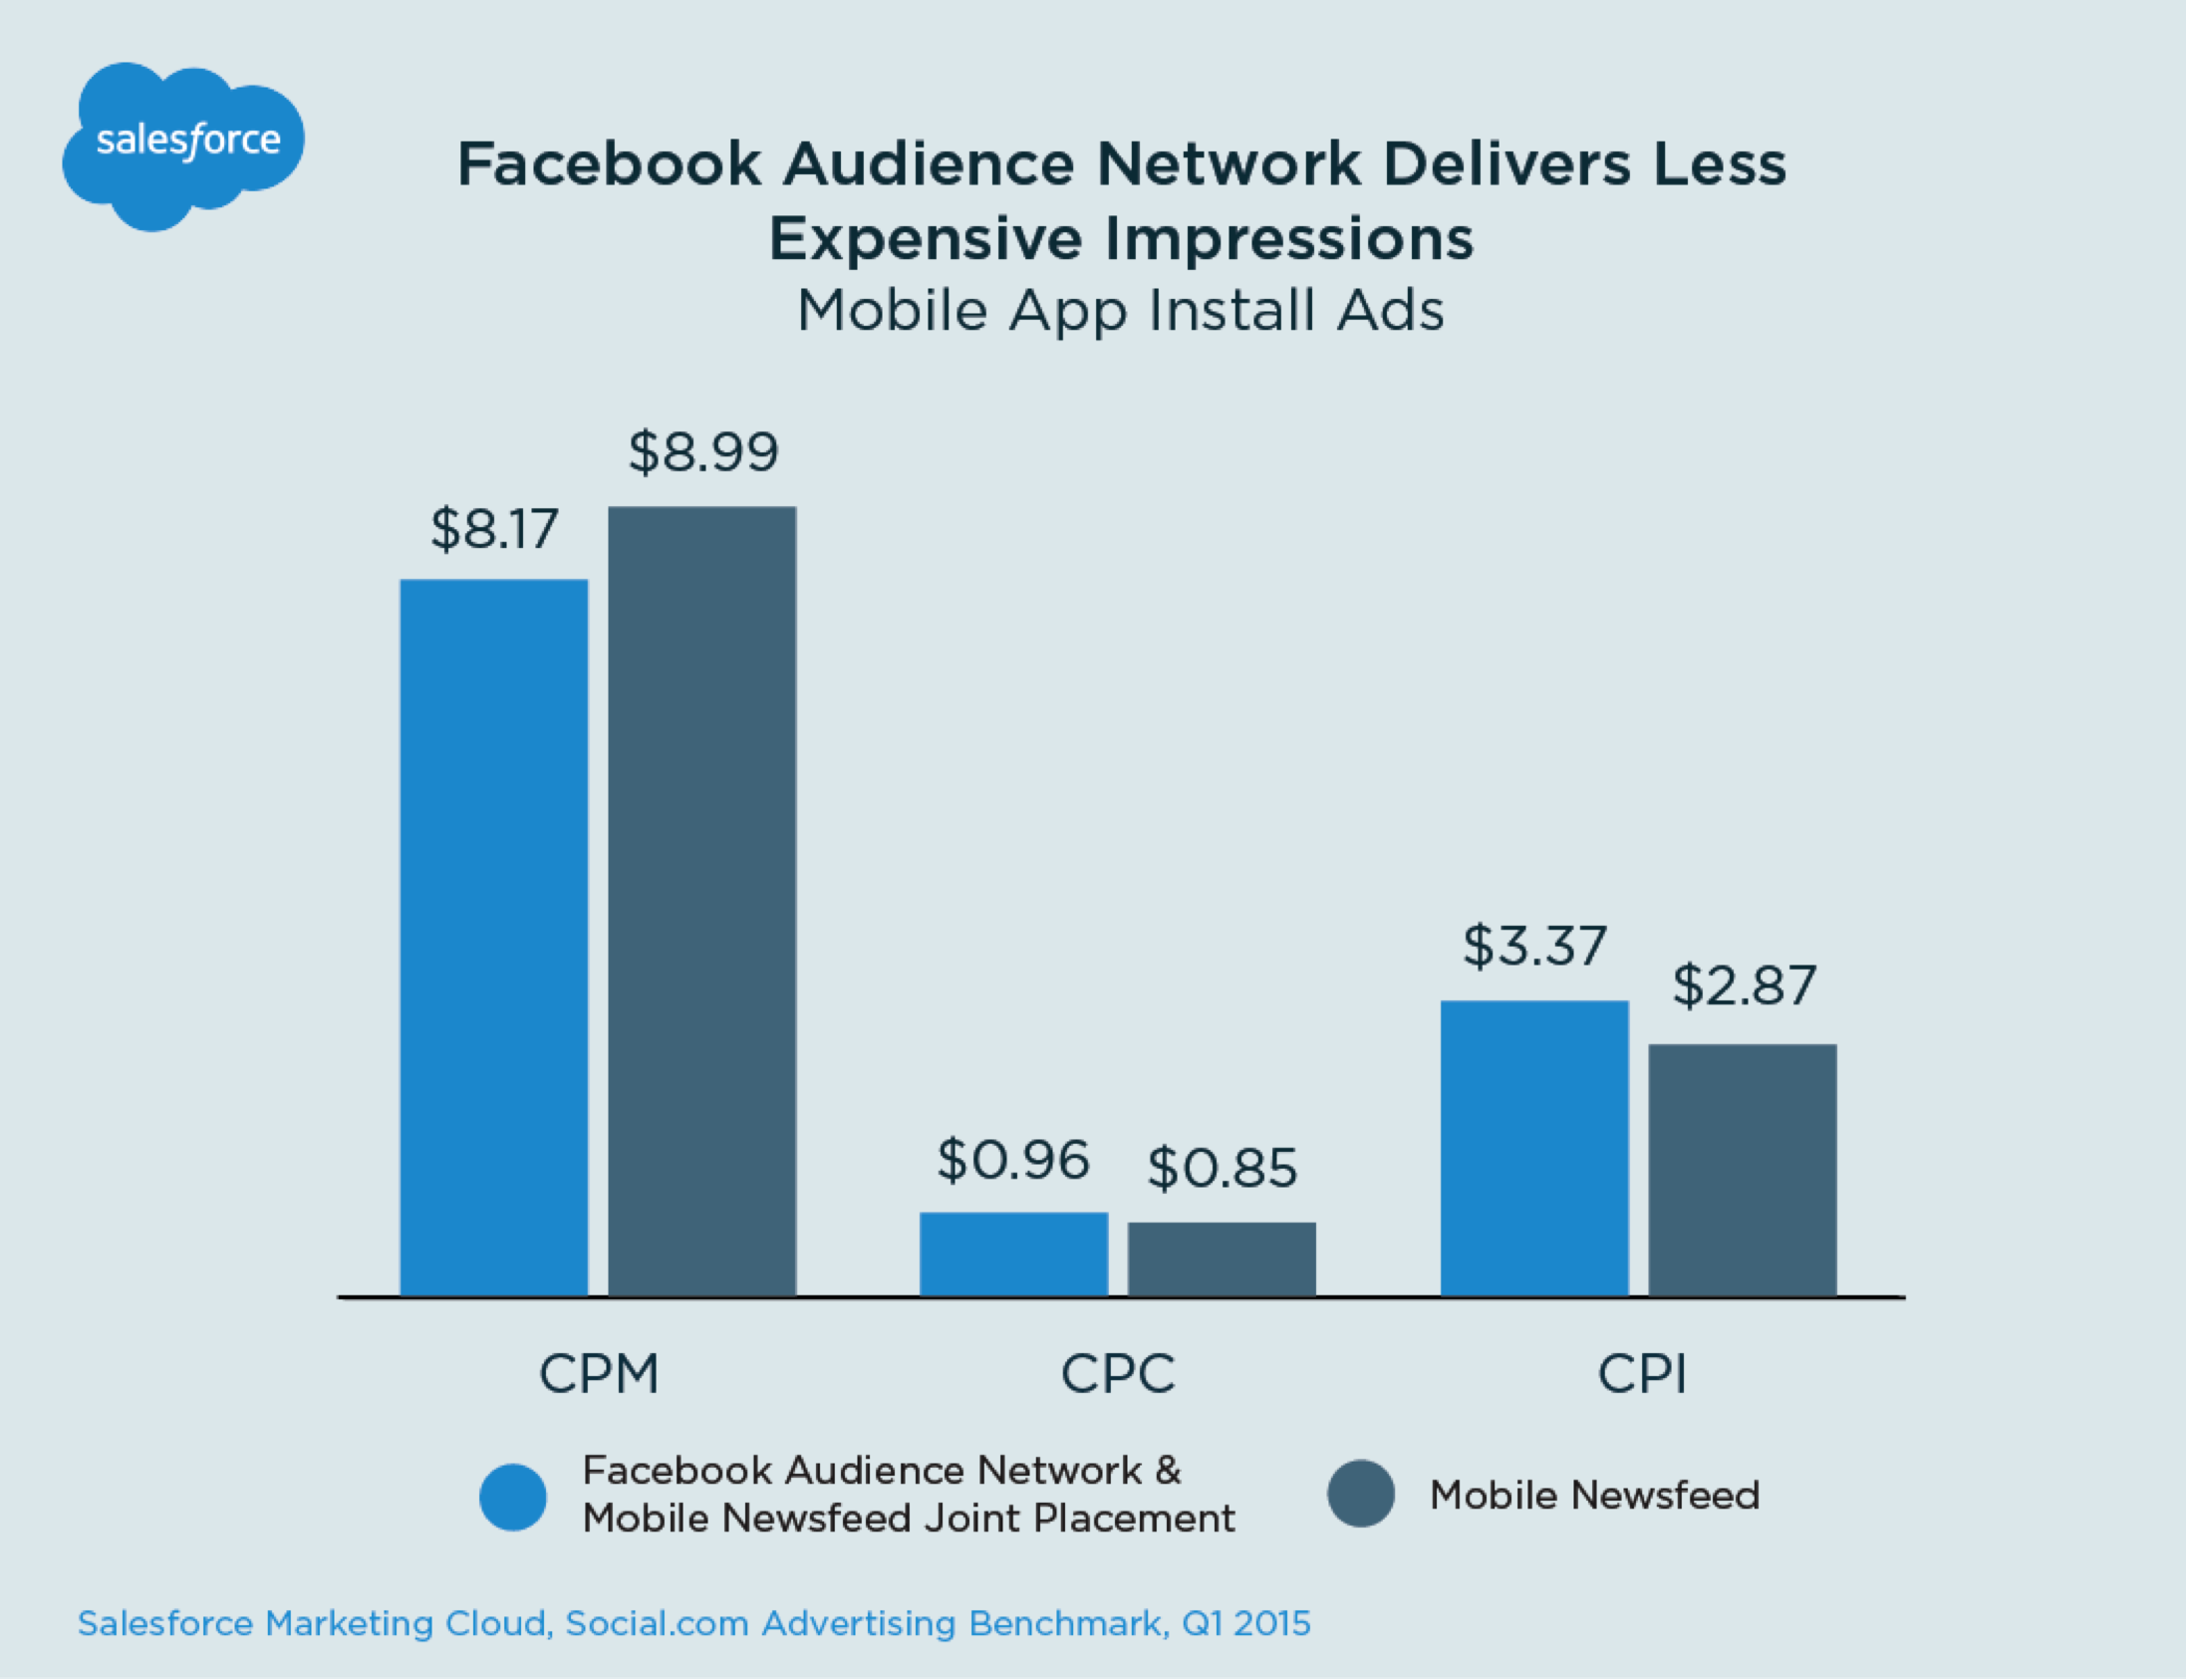
Facebook Audience Network is a relatively new way of placing ads and in this report, we provide an early look at its effectiveness for Mobile App Install ads. For these ads, the Facebook Audience Network provided a 9% cheaper CPM than just targeting the Mobile Feed in Q1.
However, advertisers are engaging with the ads at a lower rate on the Facebook Audience Network, as shown by both a 20% lower CTR and then a 3% lower install conversion rate with the people who do click on the ads. These factors drove an 18% higher CPI ($2.87 versus $3.37). Advertisers using Facebook Audience Network must test their ad targeting, in order to maintain sufficiently high install conversion rates and the desired CPI.
On Twitter, Promoted Tweet CPE was flat from Q4 to Q1. However, the engagement on the ads fell from 2.28% to 2.00%, and the CPM decreased to $8.92.
On Twitter, advertisers cannot bid on a CPM basis, but must bid for some action, such as any click on a Tweet, link clicks, or video views. Therefore, you can focus on measuring the specific metrics that matter to your campaigns.

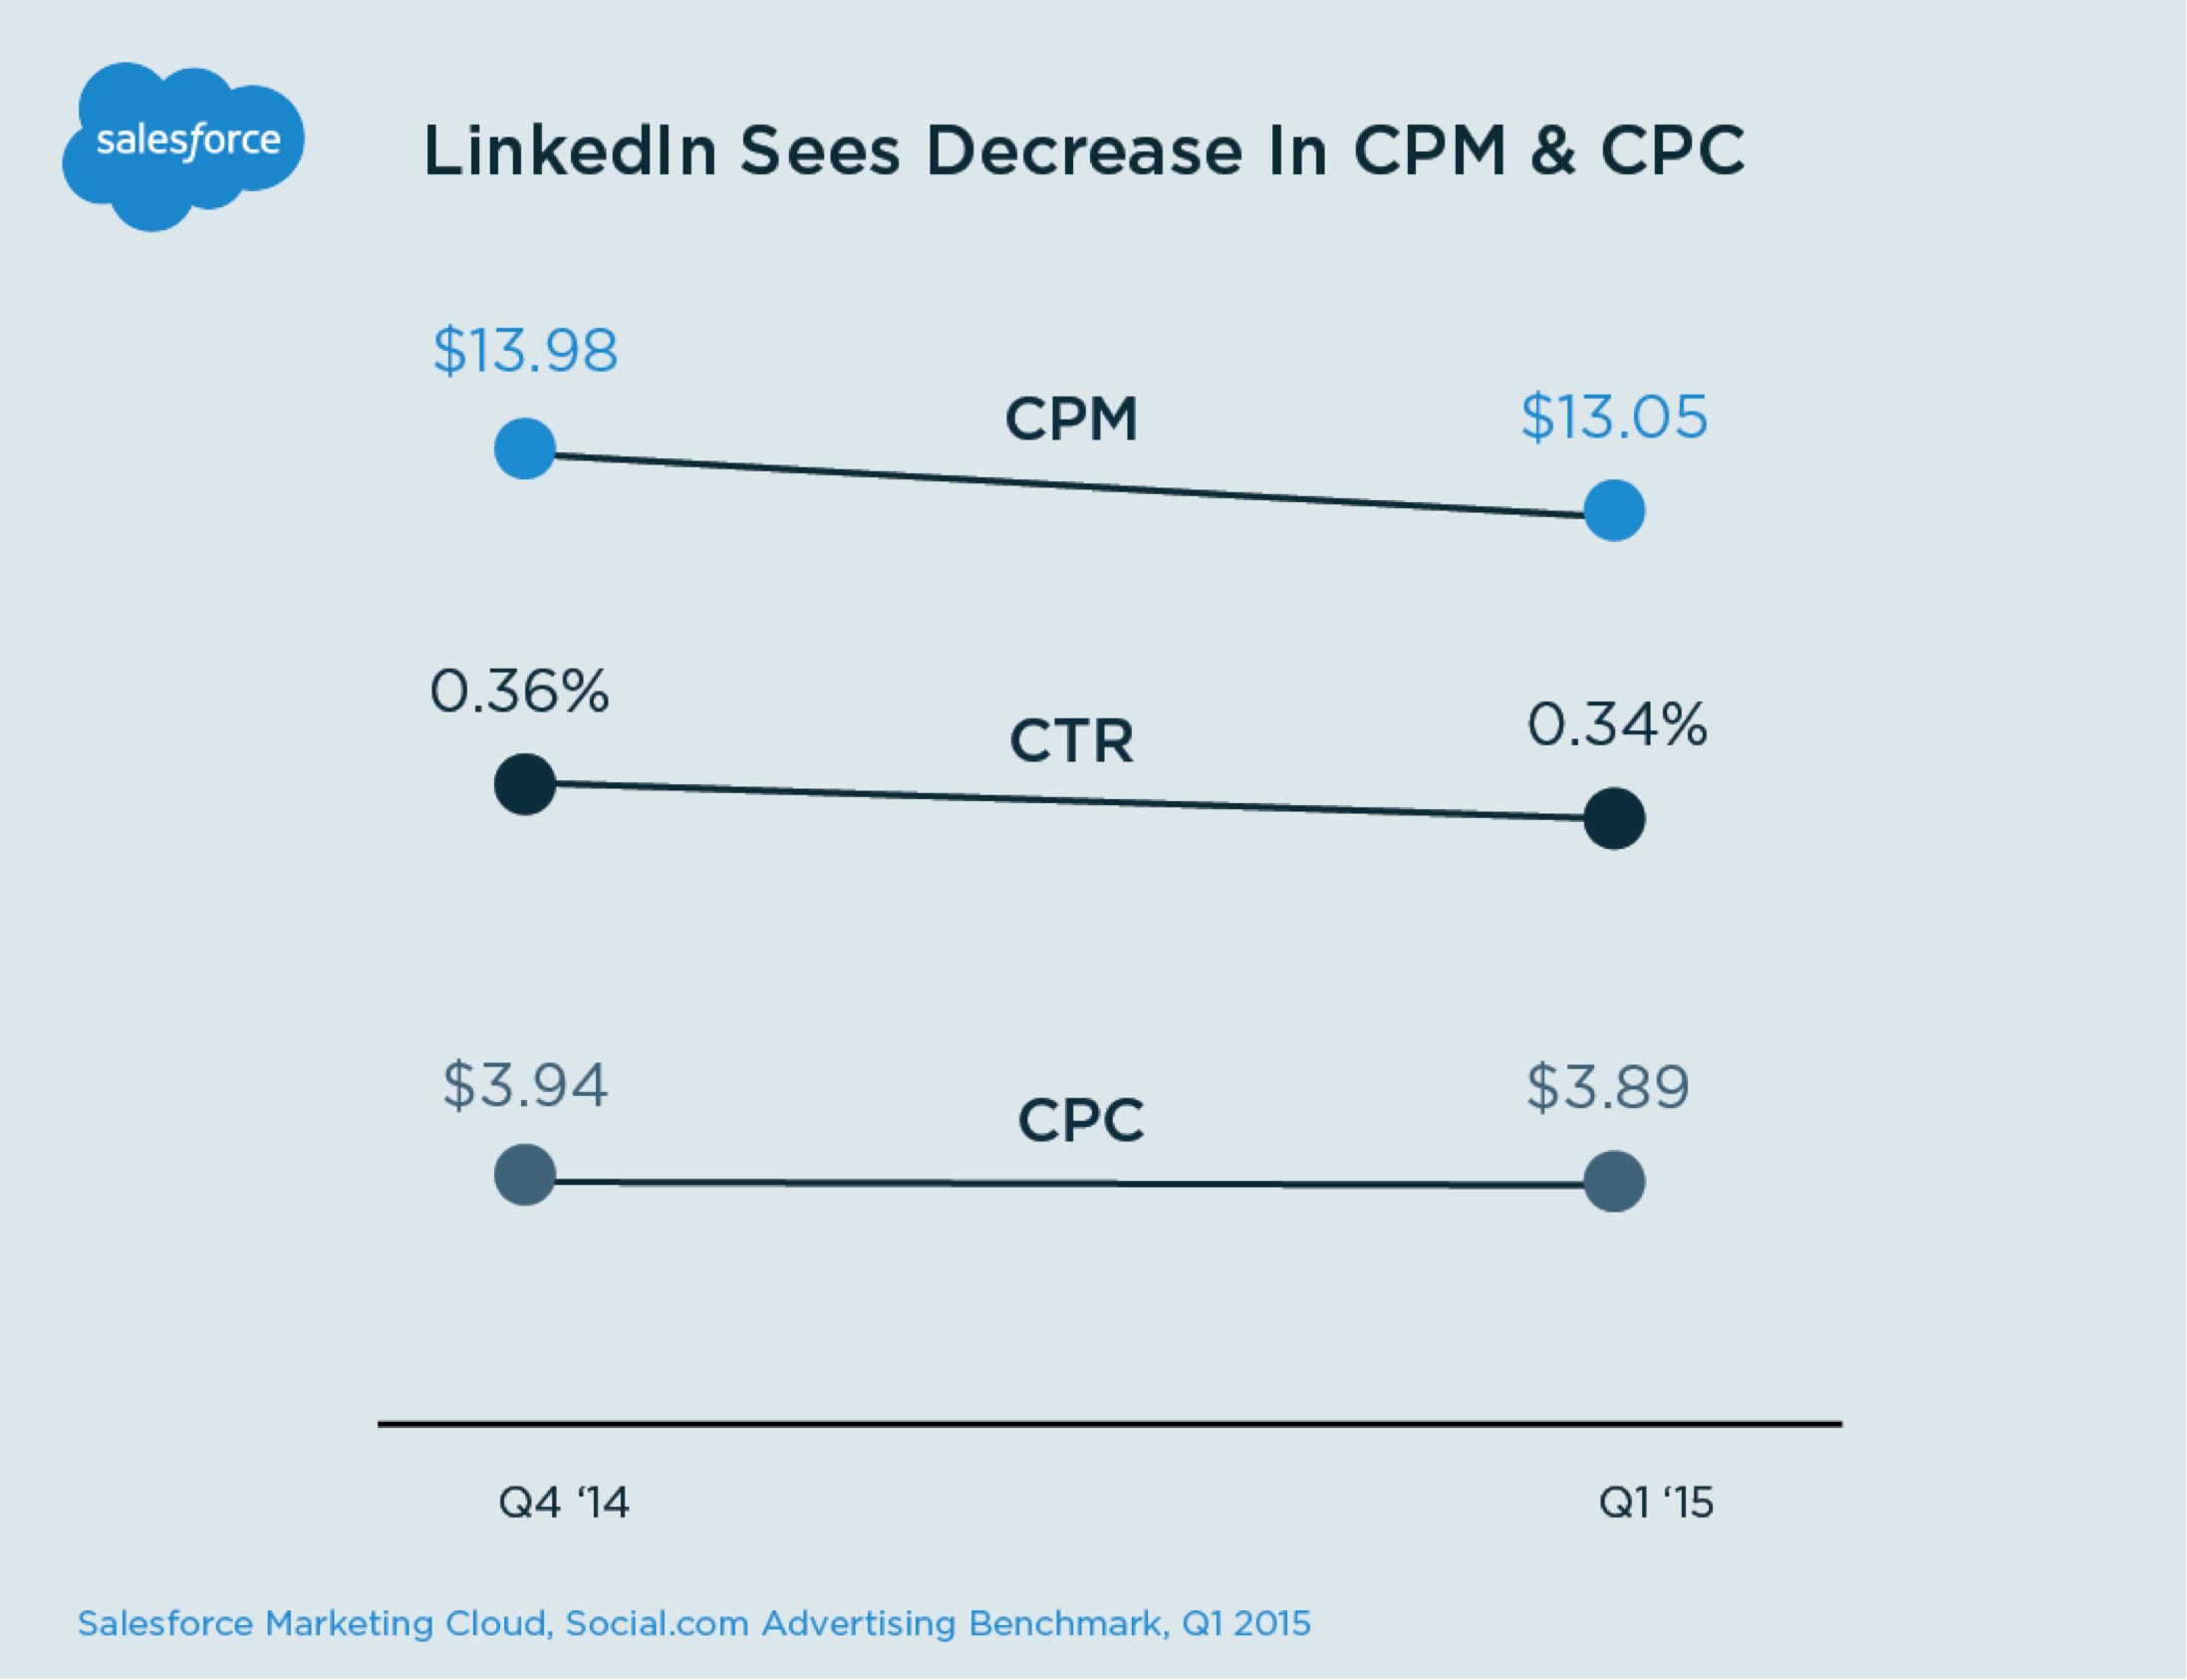
On LinkedIn, the CPM in the United States declined 7% from Q4 to Q1 to $13.05, indicated a general maturing of the ad platform. LinkedIn revenue from ads, according to their latest earnings report, has risen rapidly, with $119M in revenue from selling ads in Q1 2015, a 38% increase from Q1 2014. At the same time, Sponsored Updates (the in-feed ad unit that Social.com supports) rose to 40% of advertising revenue, up nearly double the prior year, according to Ad Age. The slight decrease in CPM indicates that more advertisers are buying more ads, not just existing advertisers are paying more for the same inventory. This bodes extremely well for the health of the LinkedIn advertising ecosystem.
This benchmark report was a collaborative project including the efforts of Chris Jacob, Zachary Reiss-Davis, Kyle Graden, Hilary Givens, and Julien Grouteau, with executive sponsorship from Liam Doyle.
For more trends, including a detailed industry breakdown by country, check out the full benchmark report or request a demo.


