


Get your FREE 30-day trial.
Please complete all fields.
This week, we’re bringing you the latest information regarding ad blocking activities and how they affect your advertising. In addition, we’ll spend time talking about new data on Google versus Facebook display ads. Finally, check out some of the newest trends in Mobile App Install ads from our recent Salesforce Advertising Benchmark Report.
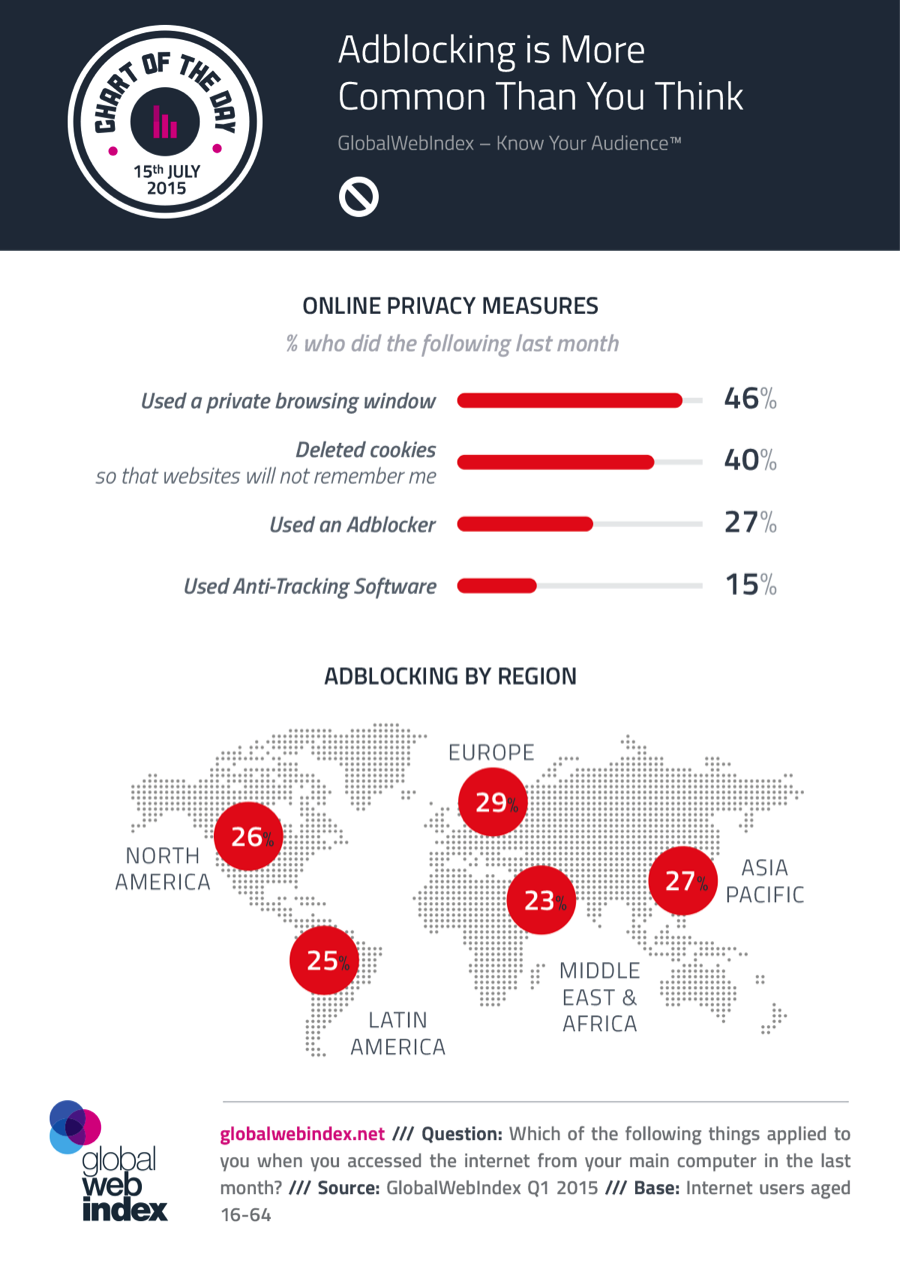
People today care more about data security and privacy than ever before, and new behaviors have arisen that affect advertisers. GlobalWebIndex surveyed online adults to see how prevalent these behaviors are. In order to protect their online footprints, users have been acquiring the help of ad blocking methods. 46% of online adults are using a private browsing window, which prevents cookies from saving any online activity. Anti tracking software is another ad blocking option that stop cookies form even being installed on your computer. You can also delete cookies off of your computer manually, done by 40% of online adults already. All three of these actions are meant to stop cookies from working, which explains why first party data is more valuable than third party data. First party data does not rely on cookies to proxy information about a user, but instead focuses on who a user actually is.
An additional method, ad blocking software, allows consumers to never see web ads created by independent ad serving networks. Globally, 27% of online adults say they routinely use ad blockers on their computers, and Europe ranks the highest in ad blocking activity at 29%. This is why native advertising is far more advantageous than non-native formats. Native ads placed within a user’s newsfeed (such as Facebook, Twitter, or LinkedIn) and ads within mobile apps are still displayed to users who are using web ad blocking software in their browser.
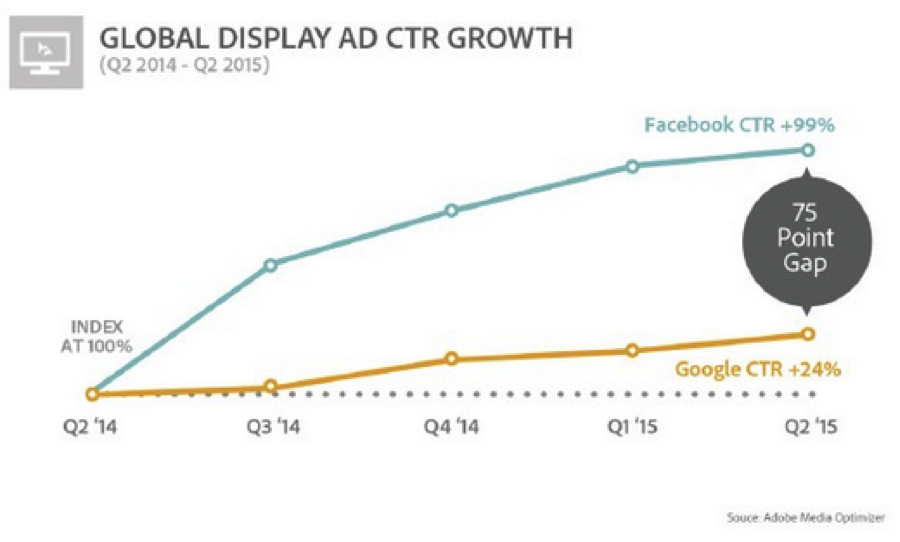
A recent study by Adobe has found that the global Facebook CTR continues to grow. Since 2014, Facebook CTR has created a 75 point gap in growth rate of the CTRs on Display, over Google. Facebook CTR is up 99% between Q2 2014 and Q2 2015, while Google’s CTR only increased by 24% in the same period. Some of Facebook’s increase is due to new, more engaging, Right Hand Side Ads, but the overall trend aligns with advantages of advertising on Facebook. Unlike Google display ads, Facebook ads are native, and part of users newsfeed. Additionally, Facebook ads are effectively 100% of ads viewable. The same cannot be said for Google display ads, where Google itself has reported that only 44% of Google ads are viewable, reported by google. Additionally Facebook ads can be targeted based on a consumer’s real identity.
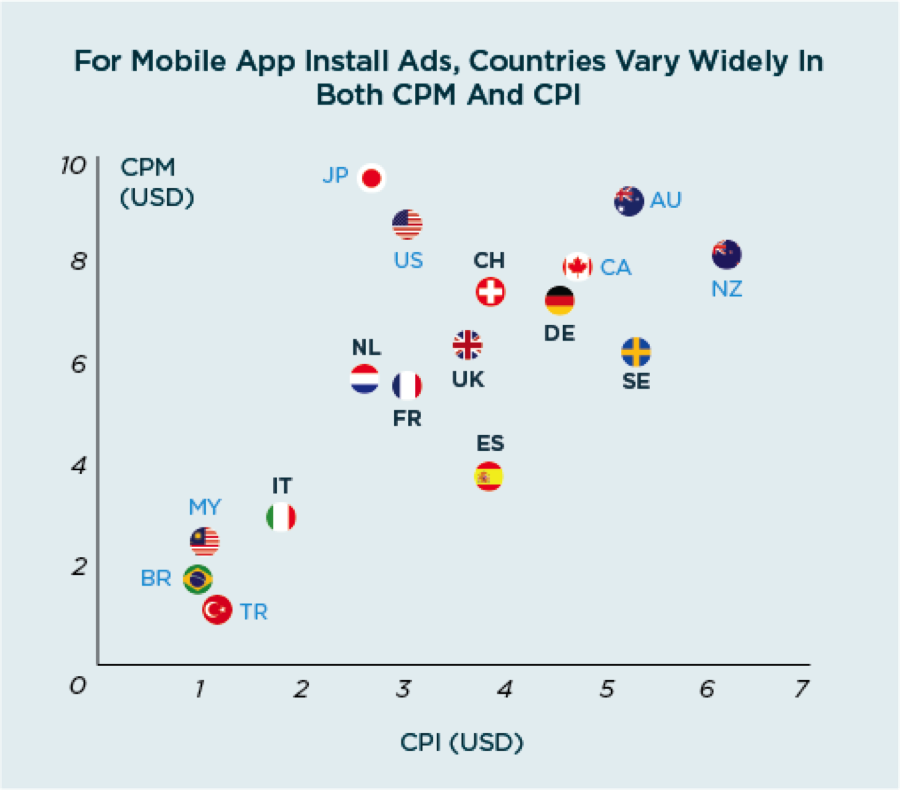
Salesforce Social.com recently released the Q1 2015 Advertising Benchmark Report, encompassing all of the latest trends in social advertising. One of the most interesting trends we examined is the growth in the usage of mobile apps and mobile app install ads. Mobile apps are where so many consumers are spending their time; According to Yahoo, 88% of the time that consumers spend on mobile devices is spent in apps, totaling 37:28 hours per month, according to Neilsen. We examined the Cost Per Install (CPI) for mobile app install campaigns, and found that it varies widely by country. New Zealand and Sweden were the most expensive countries to run mobile app install campaigns in Q1, at $6.16 and $5.28 respectively. Conversely, Brazil and Malaysia have the least expensive CPIs of the examined countries. In addition, the CTR (Click Through Rate) for mobile app install ads also vary widely by country, from a low of 0.64% in Australia, or 0.65% in United Kingdom, to a high of 1.26% in Japan. Today, advertisers can examine what countries to target with app install campaigns, within a given region or as a part of a larger global rollout. Also, advertisers can test if adding different geographies can produce better results.
To get the most up-to-date trends in Advertising, download our full Q1 2015 Advertising Benchmark Report.


