


Get your FREE 30-day trial.
Please complete all fields.
Digital mobility and connectivity grow more important every day. We know consumers keep their mobile devices nearby, check them frequently, and occasionally use multiple devices at once. But what do they actually click on, download, explore, peruse, and avoid on their mobile devices? Survey responses are one thing, but tracking data-based on actual consumer action-helps to further demystify consumer mobile behavior.
As part of the just-released 2014 Mobile Behavior Report, we tracked 470 voluntary consumers for a month to see how they used their smartphones and tablets to access the mobile web and mobile apps. The research also asked these consumers questions about how they use and view mobile devices in their lives.
Our research sought to:
Like the societal and personal effects of electricity and the Model T, the smartphone continues to revolutionize daily activities and how people perform them. Through analysis of our smartphone and tablet tracking data (via Luth Research's ZQ technology) and consumers' own survey responses, several primary conclusions emerged about the state of mobile behavior.
Here's just a taste of what we discovered.
These charts show a few visual findings from this research (and these just scratch the surface what we discovered):
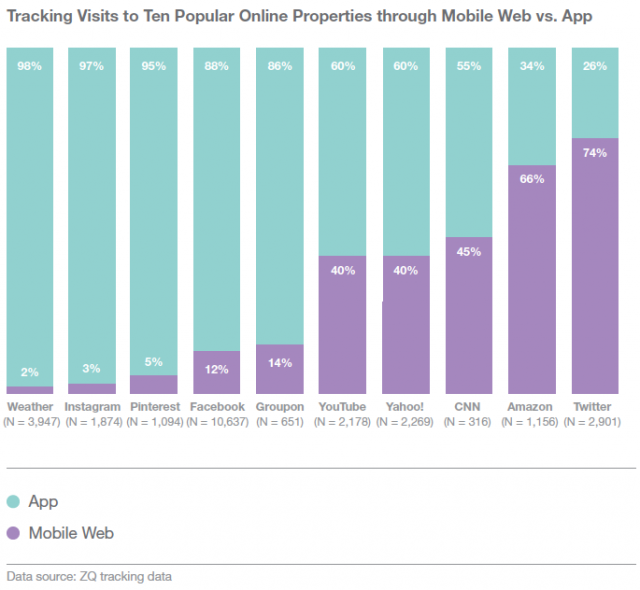
People access mobile apps and the mobile web (i.e., the internet browser within a mobile phone, like Safari on iOS) differently. As shown in the chart "Tracking Visits to Ten Popular Online Properties through Mobile Web vs. App," although both apps and mobile websites allow people to consume content on the go, many people prefer a mobile app in practice. For these ten properties, people preferred the app in all instances except Amazon and Twitter.
Weather, Instagram, Pinterest, Facebook, and Groupon visitors showed especially high propensity to turn to the app instead of the mobile website for on-thego content. YouTube, Yahoo, and CNN have just under half of their visitation on mobile websites, with about six in ten sessions happening through a mobile app.
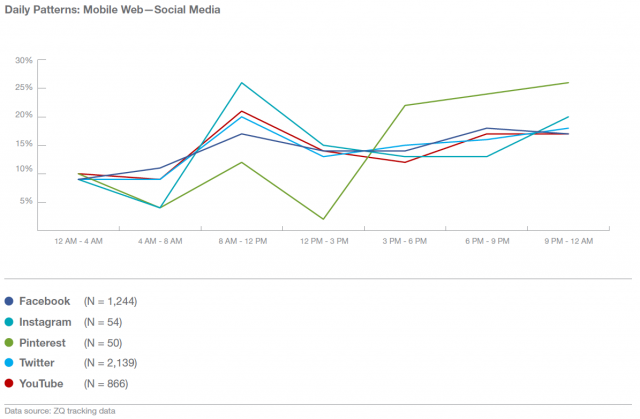
We tracked consumer visits to these five social media sites on the mobile web; this chart depicts daily visitation averages (Daily Patterns: Mobile Web-Social Media). Note Pinterest's especially high afternoon/evening usage.
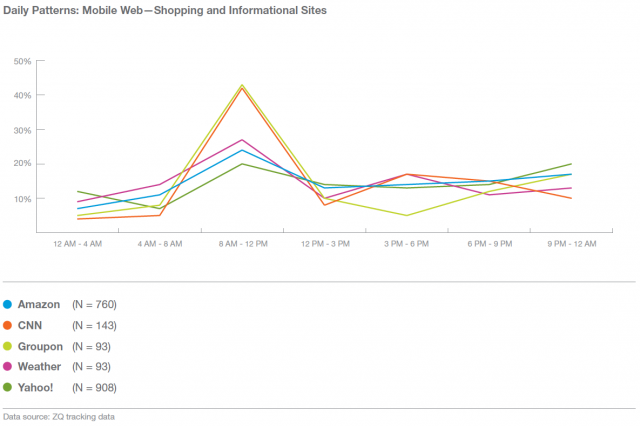
The "Daily Patterns: Mobile Web-Shopping and Informational Sites" chart depicts daily averages of when consumers access these five shopping and informational sites on the mobile web, based on tracking data. As might be expected, every mobile website saw a sharp increase in traffic from 8 a.m. to 12 p.m.
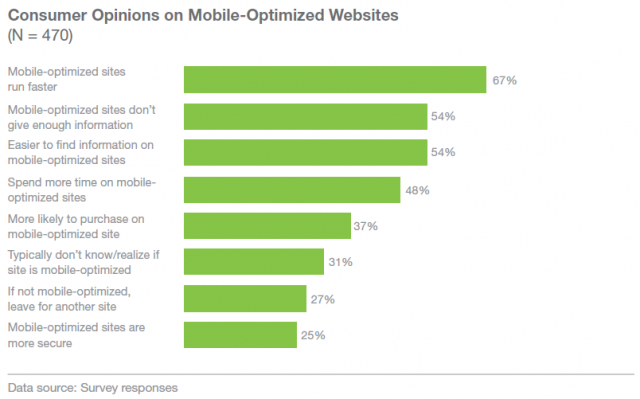
The chart "Consumer Opinions on Mobile-Optimized Websites" shows consumers' thoughts about their experiences on the mobile web. The mobile web is lagging behind in optimization and content standards, according to some consumers. While 54% of consumers agree that it's easier to find information on mobileoptimized websites, 54% are also dissatisfied, saying mobile-optimized websites don't provide enough information. Mobile-optimized sites may be more user-friendly (67% also say they run more quickly), but they aren't meeting users' demands for how much content is actually stored on a mobile site.
These findings are only the top layer of the deep research dive we took in the 2014 Mobile Behavior Report. Check out the full research and find out even more about consumers' current behavior and preferences around branded push notifications, text messaging, mobile email, social media, and more.


