Get your FREE 30-day trial.
Please complete all fields.
You have lots of data. You need insights. Where do you start to connect the dots between the two? We get this question a lot, typically from starting data scientists, analysts and managers new to data science.
Their bosses are under pressure to show some ROI from all the money that has been spent on systems to collect, store and organize the data (not to mention the money being spent on data scientists).
Sometimes they are lucky — they may be asked to solve a very specific and well-studied problem (e.g., predict which customer is likely to cancel their mobile contract). In this situation, there are numerous ways to skin the cat and it is data science heaven.
But often they are simply asked to “mine the data and tell me something interesting”.
Where to start?
This is a difficult question and it doesn’t have a single, perfect answer. I am sure experienced practitioners have evolved many ways to do this. Here’s one way that I have found to be useful.
It is based on two notions:
Given this, you can think of an “insight” as anything that increases your understanding of how the system actually works. It bridges the gap between how you think the system works and how it really works.
Or, to borrow an analogy from Andy Grove’s High Output Management, complex systems are black-boxes and an insight is like a window cut into the side of the black box that “sheds light” on what’s going on inside.
So the search for insight can be thought of as the effort to understand how something complicated really works by analyzing its data.
But this is the sort of thing that scientists do! The world is unbelievably complex and they have a tried-and-tested playbook to gradually increase our understanding of it — the Scientific Method.
Informally:
Data scientists and analysts can do the same thing.
Before you explore the data, write down a short list of what you expect to see in the data: the distribution of key variables, the relationships between important pairs of them, and so on. Such a list is essentially a prediction based on your current understanding of the business.
Here’s a real example. A few years ago, we were looking at transaction data from a large B2C retailer. One of the fields in the dataset was ‘transaction amount’.
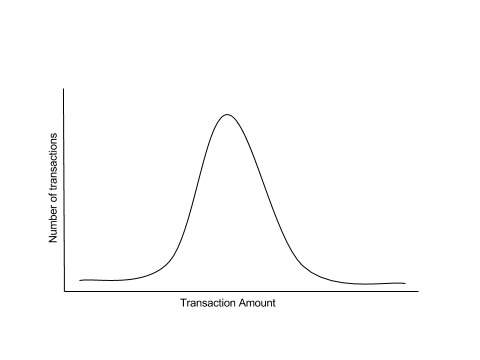
What did we expect to see? Well, we expected that most amounts would be around the average, but there will likely be some smaller amounts and some larger amounts. So a histogram of the field would probably look like this:

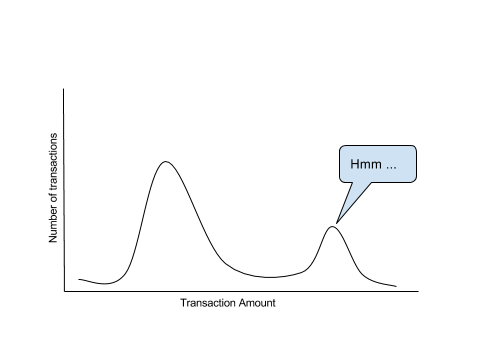
But when we checked the data, this is what we saw:

We investigated the ‘hmm’.
Turns out these transactions weren’t made by their typical shopper — young moms shopping for their kids. They were made by people who would travel to the US from abroad once a year, walk into a store, buy lots of items, take them back to their country and sell them in their own stores. They were resellers who had no special relationship with our retailer.
This retailer didn’t have a physical presence outside North America at that time nor did they ship to those locations from their e-commerce site. But there was enough demand abroad that local entrepreneurs had sprung up to fill the gap.
This modest “discovery” set off a chain reaction of interesting questions on what sorts of products these resellers were buying, what promotional campaigns may be best suited for them, and even how this data can be used to inform global expansion plans.
All from a simple histogram.
The wonderful Isaac Asimov captured the spirit of this beautifully.
The most exciting phrase to hear in science, the one that heralds new discoveries, is not ‘Eureka!’ but ‘That’s funny…’
Note that working back from the data to the “root cause” in the business takes time, effort, and patience. If you have a good network of contacts in the business who can answer your questions, the more productive you will be. Also, what’s an oddity to you may be obvious to them (since their understanding of the business may be better than yours) and you can save time.
In general, the more you understand the nuances of the business, the more pointed your predictions will be, and ultimately the better insights you will find. So, do everything you can to get into the details of the business. Seek out colleagues who understand the business, learn from them, and if possible make them your co-conspirators.
Data science knowledge is obviously a good thing to have, but your knowledge of the business will have a much bigger impact on the quality of your work.
Beyond data science work, I have found this “predict-and-check” mindset to be useful when looking at any piece of analysis.
Before “flipping the page”, pause for a few seconds to guess what sort of things you would expect to see. You may find that this increases the contrast and you are better able to spot interesting things in a sea of numbers.