Sales teams and our journey to becoming a data driven culture
At Salesforce we strive to put the power of the data in the hands of the salesperson. Ensuring it’s easy to interpret and access, insightful, and intelligent in recommendations given. New features and products are regularly made available, which makes for ripe picking for introducing innovation. Over the past five years, our product offering has grown, the data we’ve accumulated has grown, as has investment in data-skilled personnel, and the way in which we use artificial intelligence (AI) has also greatly matured.
Salesforce is no different to any other company grappling with this type of digital transformation. Leadership buy-in, sales enablement, cross-departmental collaboration, and data standardisation have all played a factor. The Salesforce that existed five years ago and the data and tools we used in sales is far different to what they are now - and for the better because of this constant innovation and transformation. Let’s look at some practical examples of our data driven business and the benefits seen.
1. Globally standardising and scaling dashboards for sales management
As Salesforce grew, our organisational structure, products, and reporting mechanism became more complex. More acquisitions, more products to sell, more product innovation, more customers to cover, more headcount to plan for, and a growing addressable market. This means more data to crunch and make actionable to salespeople.
We wanted to shift sales management’s mindset and approach to become more data driven in running their business — e.g. enabling sales management to analyse their own pipeline trend over a given period of time. And to scale these types of best practices, we wanted to implement an industry leading sales operational governance model — e.g. a regular cadence to reviewing data and agreement on the most important KPIs.
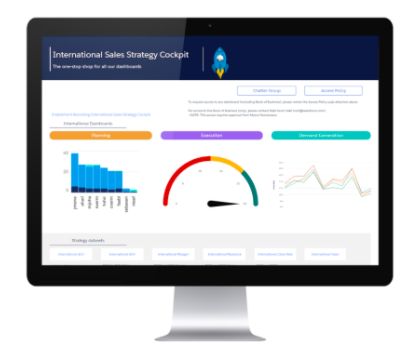
This led to an acute need to standardise the dashboards, data and KPIs we wanted our sales management to run their business by. As a result globally, sales management now use the same tools — simply applying a filter in the management hierarchy to see their own data. I cannot underestimate how powerful an impact this has. Knowing the data is trustworthy, easy to access, and requires no setup for the sales manager. To this day, we continue to use a mixture of Sales Cloud reports and dashboards, Einstein Analytics, Quip and Tableau that have all been a part of this standardisation. I also foresee Tableau forming a bigger part in how we work going into the future too.

2. Data science and next-best-product sell for cross-selling
The very fabric of our technology infrastructure means we are able to look at a customers usage insights of our products. These indicators, amongst other data points, act as a fantastic base on which to build a next-best-product to sell model.
This data-based model is often referred to as propensity-to-buy, and is a frequently referred to data for cross-selling into our customer base. Various data points give a rating sore of the likelihood of a customer buying an alternative product. This fuels next recommendations that are provided directly to salespeople. This has been a huge addition to our sales armoury — knowing that the suggestions are based on sound and logical data science methodology.
This can form a great conversation starter with a customer or can simply add to the salesperson’s intelligence on the account. With the emergence and adoption of AI (Einstein), next-best-product recommendations are continually being refined. Einstein (our artificial intelligence layering on all our products) continually picks up on indicators, crunches the data, and refines the information presented to salespeople. As the platform and Einstein continues to grow and improve, it’s exciting to consider how this use-case for sales will develop. It has also acted as great launchpad for our sales teams to quickly bring new products and innovations to market — e.g. with MuleSoft, Tableau, or Vlocity.

3. Account exploration and analysis
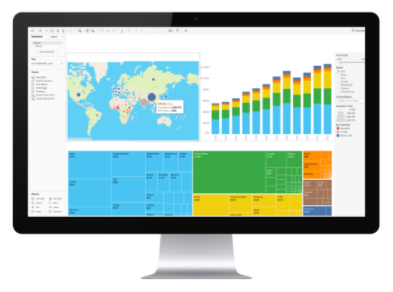
Whether working from Salesforce or Tableau (a recent acquisition), the ability to easily explore all things related to an account and analyse whats happening is a key activity we enable sales on. Our own CRM setup means there is reassurance that what you’re seeing is the single source of truth on all aspects on an account. Something that’s vital to a salesperson.
Whilst this use-case may seem simple, I’m under no illusion that many companies struggle to standardise and scale a robust account exploration and analysis model. Our own approach means there are tools, a myriad of dashboards, a reliable CRM, and a strong enablement plan for salespeople to explore and analyse data. Salespeople are easily able to analyse pipeline, activities, historical comparison analysis, financial information, how are our products being used, and a lengthy list of other data points.
When looked at through the lens of Tableau use-case in sales, it’s often the ability to slice and dice on the aforementioned data that makes people love it — and our own sales teams in that division being no different.
4. Sales KPI tracking: linking live CRM data to collaborative documents (Quip)
We’re in a fortunate position of having an excellent collaborative product in Quip. The fact that everyone is working from home at the moment has made this even more important to keeping our sales teams informed, connected and enabled. Ranging from account plans, customer facing documents, to managing product marketing assets, and sales enablement content too.
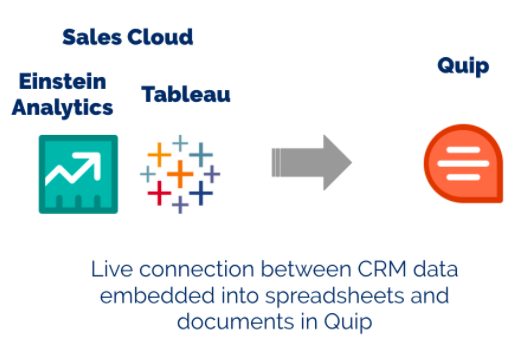
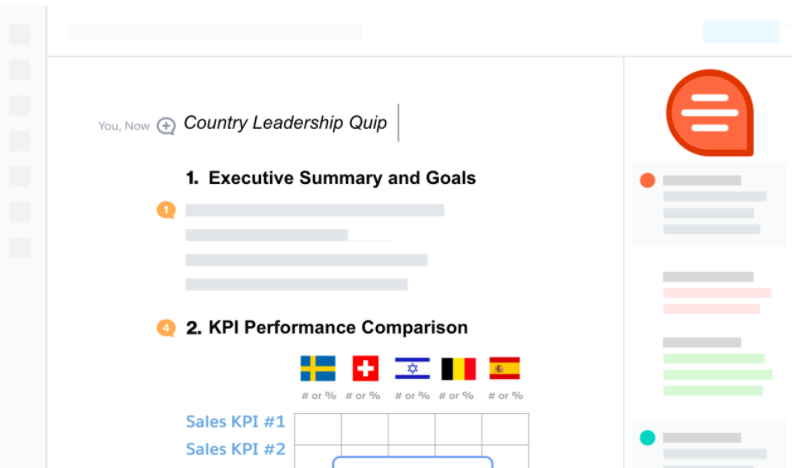
One of the more unique use-cases is for sales management to track performance across multiple metrics — connecting our CRM data into embedded spreadsheets and documents in Quip in doing so. This has been one of biggest contributors in creating a data driven culture in our management team. A Country Manager’s leadership quip, for example may contain a varied dataset that covers the below data, compared across multiple teams:
- Sales forecasting, top accounts program, customer facing activities, sales pipeline
- Year-on-year growth percentage metrics on the above
- And more..
The above Quips for us are a constant work in progress - iterating and improving based on management feedback, tweaking what data is most important to track, and usability of the tools. One thing for sure though is that they’re here to stay as they’ve proved a huge value add to how we run our business.
Summarising the impact and what you can do?
To summarise the impact the above has had on our sales organisation — it’s now a better run, better benchmarked, and a more operationally astute organisation. With data at its heart and decision making now too. Being able to easily measure and benchmark regions at any point in time has proven a huge value add. Ranging from measuring the macros (e.g. a two or three year CAGR growth metric) or the micro-environment (e.g. how many calls have my salespeople made this month).
I would encourage you to consider your own company’s positioning in how you view, use and scale access to key data that sales should have at their fingertips. Take a look at over at our Blog to see more articles related to this topic.
Or you can attend this webinar on Thursday 27th August where I’ll showcase some of the above use-cases and more. You can register here.