Get your FREE 30-day trial.
Please complete all fields.
In our personal lives, mobile apps give us instant access to insights that shape our actions and behaviors. We explore and filter thousands of flights on Kayak before booking the best option; we review real-time dashboards on Fitbit to manage our health and physical activity; and we monitor and control our home energy usage with Nest. However, when it comes to understanding our business, enterprise apps traditionally haven’t been intuitive, making it hard for business users to connect to data they need in order to uncover insights, collaborate and take action.
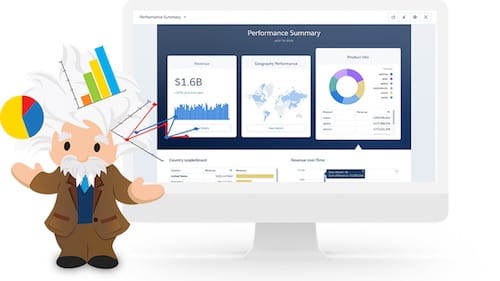
Salesforce introduced Wave Analytics to democratize analytics, embedding insights directly into business workflows and making analytics more intuitive, collaborative, actionable, and accessible on any device. We delivered Sales Wave, the first role-specific Wave Analytics app, to empower sales leaders with the insights they need to manage forecasts, pipelines, team performance and identify best practices, all to accelerate business growth. And today, we are extending the power of Wave Analytics with the general availability of two new analytics apps for customer service and IT professionals—Service Wave and Event Monitoring Wave. We are also introducing entirely new collaboration and charting functionality across all Wave Analytics Apps.
Leveraging the world’s #1 connected customer service and support platform, Service Wave Analytics arms service teams with deeper, more actionable insights that help customer service leaders and agents instantly optimize channels, improve agent efficiency, spot or address emerging trends, and much more. Service Wave delivers:
Native Integration with Service Cloud: Service Wave automatically populates with Service Cloud data so service teams can better manage service levels, customer satisfaction, team performance and more—quickly and seamlessly. In addition, Service Wave can be embedded directly into the Service Cloud Lightning Console to arm service leaders and agents with insight right where they work and allow them take instant action.
Smarter Managers: Key performance indicators such as average handle time, first contact resolution and customer satisfaction provide managers with a unified view of team and channel performance. And managers can coach their teams to success with benchmarking and historical analysis dashboards.
Faster Service Agents: Service Wave dashboards in the Service Cloud Lightning Console supercharge agent productivity, providing them with a 360-degree view of the customer right where they work. Now, an agent can review a service case alongside case history data as well as Wave insights on similar cases in order to deliver smarter, faster and more personalized service, across any channel.
Last year we introduced Salesforce Shield, a suite of native services that help customers monitor, audit and encrypt data and apps, adding an additional layer of compliance to all of your company’s Salesforce apps. Included in Salesforce Shield, Event Monitoring gives customers real-time insight into how those apps are being utilized, including when and where users are accessing information, how they use that information, as well as adoption and performance of apps. Now with the Event Monitoring Wave App, IT departments can leverage the usage data from apps across the Salesforce Customer Success Platform to uncover insights, best practices and feature adoption:
Custom Wave Dashboards: With 15 pre-built dashboards and visualizations, customers can easily gain visibility into app usage and identify common issues and best practices. Now IT departments can have a better understanding of the correlation between app usage and successful performance by reviewing pageviews, report downloads, log-in activity and more. For instance, IT can identify that high performers start their days in Salesforce preparing for customer meetings and take a data-driven approach to improving team enablement and adoption.
App Performance Visualizations: Easily visualize system performance data such as total number of transactions or report loading time in order to identify issues and proactively optimize performance of any Salesforce app.
Manage and Track Compliance: Monitor who is accessing what data, when and from where in order to easily adhere to internal and external compliance policies. With a central look into usage data, IT teams can streamline and simplify the process of ensuring all users are complying with critical policies.
Event Monitoring Wave App is included with the purchase of Event Monitoring or Salesforce Shield.
New map visualization and annotation capabilities also announced today take actionability a step further to allow business users to engage with data in entirely new ways. Now business users can supercharge collaboration with their team by engaging with data in real-time to unlock insights and take action across all Wave Analytics Apps.
Maps and Custom Visualizations- New thematic maps allow users to view data in the context of any shape or map. The new chart types have areas shaded in proportion to the measurement of the data being displayed on the map, allowing for visual pop-out of high-value areas. For example, now customers can creatively visualize anything from population density in a specific country or state to ticket sales in a football stadium.
Annotation- With new annotation capabilities users can comment in real-time, just as they would in a Google doc, posting feedback, asking questions and @mentioning relevant team members in the dashboard and in Chatter. Now teams can have more productive, contextual conversations about data, right at the point of insight and inside a dashboard.
Full- Screen Presentation Mode- With a single click, users can present live dashboards and lenses on the spot directly from Wave. With real-time access to data, customers can showcase dynamic visualizations, not static images, for more data-driven decision making.
Check out the website for additional information on how Wave Analytics Apps are helping customers be smarter about their business.