Property Finder has modernised from a print classified to a fast-growing digital real-estate business. To track the business vision, Property Finder needed to increase the awareness and visibility of key performance indicators (KPI) as a digital business. Led by Gökhan Koç, Director of Business Analytics at Property Finder, the data team has developed a series of dashboards and reports that are now widely engaged with. The business is using its Tableau analytics technology to simulate different business scenarios.
In 2005 Property Finder was a classified magazine; today the business connects millions of property seekers to brokers and developers from seven offices serving the rapidly changing property markets of Bahrain, Egypt, Qatar, Saudi Arabia, Turkey, and the United Arab Emirates. Customers can find homes for sale or rent via the portal, which links real estate professionals to home seekers. “Property Finder facilitates the residential and commercial property-hunting journey for buyers, renters, and brokers,” says Koç of the business.
Data driven decision means better decisions, faster
“One of the five core values of Property Finder is that data beats opinion,” Koç says of how the business wanted greater visibility of its KPI. “You cannot improve what you cannot measure,” he says. To tackle this business problem, Property Finder began by creating a centralised analytics team before starting to work on a single version of truth for the business. “With centralised analytics and standardised KPIs, we are able to make sure the KPIs are visible to the right audience, which enables them to make the right decisions in a swift manner.”
This has led to Koç being able to deliver self-service analytics across the business, which is reducing bottlenecks of demand. “Access to insights was taking time, with lots of ad hoc requests that the team could not handle,” he says. The need for data was rising due to the pace of growth at Property Finder, and Koç understands this: “You don’t want to get to start a project or a transformation and wait for months to see the first outcome of it. By that time, the train has already left the station,” He adds of the need to be responsive: “In today’s world and competitive landscape of the markets, you either deliver something quickly, or it becomes irrelevant. The more you know about your customers or users, the more you tailor your product to them. Then the more relevant you are, with higher engagement or retention of your clients.”
Measuring performance through data driven decision making
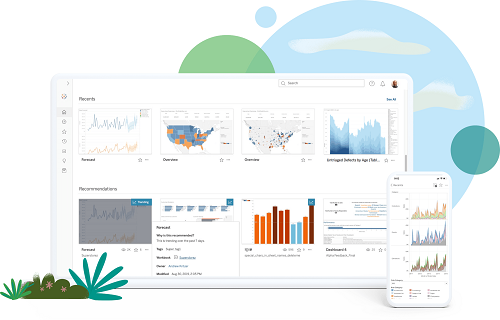
The adoption of Tableau, the Salesforce analytics platform, enabled Property Finder to: “establish a good understanding of its data. Tableau makes sure there is a clear visualisation of the data that is delivered quickly,” Koç says.
With Property Finder able to see and measure its business performance against its KPIs, Koç says there has been a cultural shift in the business. “Our success inspired the HR team to do their analytics and dashboards. People love to read the dashboards and reports that they receive. This is helping onboard people to our data and analytics transformation journey."
“Over time, people learn to ask about data as well. When there is a new launch of a product feature or a new initiative, people start to think about how we will measure its impact. The more they ask, the more they get, and more fact-driven decisions are made.”
Property Finder is an example of how markets are digitising, and moving away from old business models as their customers adopt online tools and methods. In order to meet the needs of customers, analytics and data provide businesses like Property Finder with the ability to measure their business performance constantly.


